Food Lion 2013 Annual Report Download - page 159
Download and view the complete annual report
Please find page 159 of the 2013 Food Lion annual report below. You can navigate through the pages in the report by either clicking on the pages listed below, or by using the keyword search tool below to find specific information within the annual report.-
 1
1 -
2
-
3
-
4
-
5
-
6
-
7
-
8
-
9
-
10
-
11
-
12
-
13
-
14
-
15
-
16
-
17
-
18
-
19
-
20
-
21
-
22
-
23
-
24
-
25
-
26
-
27
-
28
-
29
-
30
-
31
-
32
-
33
-
34
-
35
-
36
-
37
-
38
-
39
-
40
-
41
-
42
-
43
-
44
-
45
-
46
-
47
-
48
-
49
-
50
-
51
-
52
-
53
-
54
-
55
-
56
-
57
-
58
-
59
-
60
-
61
-
62
-
63
-
64
-
65
-
66
-
67
-
68
-
69
-
70
-
71
-
72
-
73
-
74
-
75
-
76
-
77
-
78
-
79
-
80
-
81
-
82
-
83
-
84
-
85
-
86
-
87
-
88
-
89
-
90
-
91
-
92
-
93
-
94
-
95
-
96
-
97
-
98
-
99
-
100
-
101
-
102
-
103
-
104
-
105
-
106
-
107
-
108
-
109
-
110
-
111
-
112
-
113
-
114
-
115
-
116
-
117
-
118
-
119
-
120
-
121
-
122
-
123
-
124
-
125
-
126
-
127
-
128
-
129
-
130
-
131
-
132
-
133
-
134
-
135
-
136
-
137
-
138
-
139
-
140
-
141
-
142
-
143
-
144
-
145
-
146
-
147
-
148
-
 149
149 -
 150
150 -
 151
151 -
 152
152 -
 153
153 -
 154
154 -
 155
155 -
 156
156 -
 157
157 -
 158
158 -
 159
159 -
 160
160 -
 161
161 -
 162
162 -
 163
163 -
 164
164 -
 165
165 -
 166
166 -
 167
167 -
 168
168 -
 169
169 -
170
-
171
-
172
-
173
-
174
-
175
-
176
 |
 |

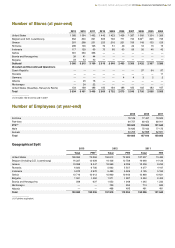
Number of Stores (at year-end)
2013
2012
2011
2010
2009
2008
2007
2006
2005
2004
United States
1 360
1 364
1 462
1 442
1 423
1 408
1 387
1 366
1 354
1 356
Belgium and G.D. Luxembourg
852
840
821
805
792
771
734
840(1)
806
745
Greece
281
268
251
223
216
201
159
148
135
129
Romania
296
193
105
72
51
40
22
18
16
16
Indonesia
117
103
89
73
66
63
56
50
46
42
Serbia
381
363
366
—
—
—
—
—
—
—
Bosnia and Herzegovina
39
41
44
—
—
—
—
—
—
—
Bulgaria
54
43
42
—
—
—
—
—
—
—
Subtotal
3 380
3 215
3 180
2 615
2 548
2 483
2 358
2 422
2 357
2 288
Divested and Discontinued Operations
Czech Republic
—
—
—
—
—
—
—
97
94
97
Slovakia
—
—
—
—
—
—
—
—
—
11
Germany
—
—
—
—
—
4
4
3
2
2
Albania
—
23
18
—
—
—
—
—
—
—
Montenegro
—
24
22
—
—
—
—
—
—
—
United States (Sweetbay, Harveys & Reid’s)
154
189
188
185
184
186
183
183
183
167
Total
3 534
3 451
3 408
2 800
2 732
2 673
2 545
2 705
2 636
2 565
_____________
(1) Includes 132 Di stores sold in 2007.
Number of Employees (at year-end)
2013
2012
2011
Full-time
76 126
77 457
78 945
Part-time
84 757
80 453
80 911
FTE(1)
120 606
119 804
121 648
Male
76 630
75 102
77 175
Female
84 253
82 808
82 681
Total
160 883
157 910
159 856
Geographical Split
2013
2012
2011
Total
FTE(1)
Total
FTE
Total
FTE
United States
108 053
73 069
104 613
72 003
107 237
74 492
Belgium (including G.D. Luxembourg)
16 227
13 609
16 438
13 708
16 968
14 139
Greece
10 958
8 547
10 599
8 306
10 438
8 234
Romania
6 820
6 700
5 693
5 557
4 277
4 167
Indonesia
5 670
5 670
5 489
5 489
5 165
5 165
Serbia
10 716
10 612
10 860
10 646
10 890
10 621
Bulgaria
1 501
1 462
1 971
1 907
2 442
2 425
Bosnia and Herzegovina
938
937
1 053
1 048
1 245
1 232
Montenegro
—
—
706
655
713
692
Albania
—
—
488
485
481
481
Total
160 883
120 606
157 910
119 804
159 856
121 648
_____________
(1) Full-time equivalent.
DELHAIZE GROUP ANNUAL REPORT 2013 FINANCIAL STATEMENTS
157