Food Lion 2013 Annual Report Download - page 76
Download and view the complete annual report
Please find page 76 of the 2013 Food Lion annual report below. You can navigate through the pages in the report by either clicking on the pages listed below, or by using the keyword search tool below to find specific information within the annual report.-
 1
1 -
2
-
3
-
4
-
5
-
6
-
7
-
8
-
9
-
10
-
11
-
12
-
13
-
14
-
15
-
16
-
17
-
18
-
19
-
20
-
21
-
22
-
23
-
24
-
25
-
26
-
27
-
28
-
29
-
30
-
31
-
32
-
33
-
34
-
35
-
36
-
37
-
38
-
39
-
40
-
41
-
42
-
43
-
44
-
45
-
46
-
47
-
48
-
49
-
50
-
51
-
52
-
53
-
54
-
55
-
56
-
57
-
58
-
59
-
60
-
61
-
62
-
63
-
64
-
65
-
 66
66 -
 67
67 -
 68
68 -
 69
69 -
 70
70 -
 71
71 -
 72
72 -
 73
73 -
 74
74 -
 75
75 -
 76
76 -
 77
77 -
 78
78 -
 79
79 -
 80
80 -
 81
81 -
 82
82 -
 83
83 -
 84
84 -
 85
85 -
 86
86 -
87
-
88
-
89
-
90
-
91
-
92
-
93
-
94
-
95
-
96
-
97
-
98
-
99
-
100
-
101
-
102
-
103
-
104
-
105
-
106
-
107
-
108
-
109
-
110
-
111
-
112
-
113
-
114
-
115
-
116
-
117
-
118
-
119
-
120
-
121
-
122
-
123
-
124
-
125
-
126
-
127
-
128
-
129
-
130
-
131
-
132
-
133
-
134
-
135
-
136
-
137
-
138
-
139
-
140
-
141
-
142
-
143
-
144
-
145
-
146
-
147
-
148
-
149
-
150
-
151
-
152
-
153
-
154
-
155
-
156
-
157
-
158
-
159
-
160
-
161
-
162
-
163
-
164
-
165
-
166
-
167
-
168
-
169
-
170
-
171
-
172
-
173
-
174
-
175
-
176
 |
 |

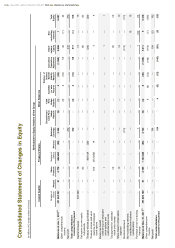
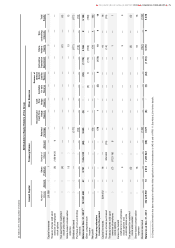
Consolidated Statement of Changes in Equity
(in millions of €, except number of shares)
Attributable to Equity Holders of the Group
Issued Capital Treasury Shares Other Reserves
Number of
Shares Amount
Share
Premium
Number of
Shares Amount
Retained
Earnings
Discontinued
Cash Flow
Hedge
Reserve
Cash
Flow
Hedge
Reserve
Available
for sale
Reserve
Remeas. of
Defined
Benefit
Liability
Reserve
Cumulative
Translation
Adjustment
Share-
holders’
Equity
Non-
controlling
Interests
Total
Equity
Balances at Jan. 1, 2011(1)
101 555 281
51
2 778
988 860
(59)
3 424
(9)
(1)
4
(28)
(1 094)
5 066
1
5 067
Other comprehensive
income
— — — — — — — (3) 2 (10) 56 45 (1) 44
Net profit
—
—
—
—
—
472
—
—
—
—
—
472
—
472
Total comprehensive
income for the period
— — — — — 472 — (3) 2 (10) 56 517 (1) 516
Capital increases
336 909
—
13
—
—
—
—
—
—
—
—
13
—
13
Call option on own equity
instruments
— — (6) — — — — — — — — (6) — (6)
Treasury shares purchased
—
—
—
408 138
(20)
—
—
—
—
—
—
(20)
—
(20)
Treasury shares sold upon
exercise of employee
stock options
— — (10) (213 050) 14 — — — — — — 4 — 4
Excess tax benefit
(deficiency) on employee
stock options and
restricted stock units
— — 1 — — — — — — — — 1 — 1
Tax payment for restricted
stock units vested
— — (4) — — — — — — — — (4) — (4)
Share-based compensation
expense
— — 13 — — — — — — — — 13 — 13
Dividend declared
—
—
—
—
—
(174)
—
—
—
—
—
(174)
—
(174)
Non-controlling interests
resulting from business
combinations
— — — — — — — — — — — — 15 15
Purchase of non-controlling
interests
— — — — — 1 — — — — — 1 (10) (9)
Balances at Dec. 31, 2011(1)
101 892 190
51
2 785
1 183 948
(65)
3 723
(9)
(4)
6
(38)
(1 038)
5 411
5
5 416
Other comprehensive
income
— — — — — — — 4 (6) (12) (140) (154) (1) (155)
Net profit
—
—
—
—
—
104
—
—
—
—
—
104
(2)
102
Total comprehensive
income for the period
— — — — — 104 — 4 (6)
(12) (140) (50) (3) (53)
74
DELHAIZE GROUP ANNUAL REPORT 2013
FINANCIAL STATEMENTS