Food Lion 2013 Annual Report Download - page 160
Download and view the complete annual report
Please find page 160 of the 2013 Food Lion annual report below. You can navigate through the pages in the report by either clicking on the pages listed below, or by using the keyword search tool below to find specific information within the annual report.-
 1
1 -
2
-
3
-
4
-
5
-
6
-
7
-
8
-
9
-
10
-
11
-
12
-
13
-
14
-
15
-
16
-
17
-
18
-
19
-
20
-
21
-
22
-
23
-
24
-
25
-
26
-
27
-
28
-
29
-
30
-
31
-
32
-
33
-
34
-
35
-
36
-
37
-
38
-
39
-
40
-
41
-
42
-
43
-
44
-
45
-
46
-
47
-
48
-
49
-
50
-
51
-
52
-
53
-
54
-
55
-
56
-
57
-
58
-
59
-
60
-
61
-
62
-
63
-
64
-
65
-
66
-
67
-
68
-
69
-
70
-
71
-
72
-
73
-
74
-
75
-
76
-
77
-
78
-
79
-
80
-
81
-
82
-
83
-
84
-
85
-
86
-
87
-
88
-
89
-
90
-
91
-
92
-
93
-
94
-
95
-
96
-
97
-
98
-
99
-
100
-
101
-
102
-
103
-
104
-
105
-
106
-
107
-
108
-
109
-
110
-
111
-
112
-
113
-
114
-
115
-
116
-
117
-
118
-
119
-
120
-
121
-
122
-
123
-
124
-
125
-
126
-
127
-
128
-
129
-
130
-
131
-
132
-
133
-
134
-
135
-
136
-
137
-
138
-
139
-
140
-
141
-
142
-
143
-
144
-
145
-
146
-
147
-
148
-
149
-
 150
150 -
 151
151 -
 152
152 -
 153
153 -
 154
154 -
 155
155 -
 156
156 -
 157
157 -
 158
158 -
 159
159 -
 160
160 -
 161
161 -
 162
162 -
 163
163 -
 164
164 -
 165
165 -
 166
166 -
 167
167 -
 168
168 -
 169
169 -
 170
170 -
171
-
172
-
173
-
174
-
175
-
176
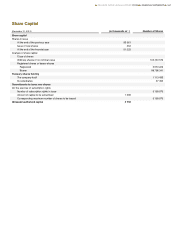
 |
 |

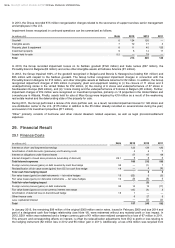
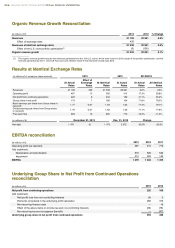
Organic Revenue Growth Reconciliation
(in millions of €) 2013 2012 % Change
Revenues
21 108
20 991
0.6%
Effect of exchange rates
430
Revenues at identical exchange rates
21 538
20 991
2.6%
Effect of the U.S. store portfolio optimization(1)
(5)
(100)
Organic revenue growth
21 533
20 891
3.1%
_____________
(1) The organic revenue growth excludes the revenues generated from the 126 U.S. stores, which were closed in 2012 as part of the portfolio optimization, and the
revenues generated by the 11 stores (8 Food Lion and 3 Bottom Dollar Food) that were closed early 2013.
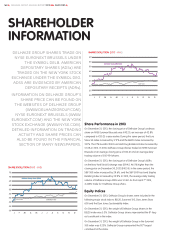
Results at Identical Exchange Rates
(in millions of €, except per share
amounts)
2013
2012
2013/2012
At Actual
Rates
Effect of
Exchange
Rates
At Identical
Rates
At Actual
Rates
At Actual
Rates
At Identical
Rates
Revenues
21 108
430
21 538
20 991
0.6%
2.6%
Operating profit
487
15
502
415
17.3%
20.8%
Net profit from continuing operations
226
8
234
160
41.1%
46.2%
Group share in net profit
179
7
186
104
71.8%
78.5%
Basic earnings per share from Group share in
net profit
1.77 0.07 1.84 1.03 71.4% 78.1%
Diluted earnings per share from Group share
in net profit
1.76 0.07 1.83 1.03 71.1% 77.8%
Free cash flow
669
16
685
773
-13.4%
-11.3%
(in millions of €)
December 31, 2013
Dec. 31, 2012
Change
Net debt
1 473
(1)
1 472
2 072
-28.9%
-29.0%
EBITDA reconciliation
(in millions of
€)
2013
2012
2011
Operating profit (as reported)
487
415
775
Add (substract):
Depreciation and amortization
579
599
540
Impairment
213
220
140
EBITDA
1 279
1 234
1 455
Underlying Group Share in Net Profit from Continued Operations
reconciliation
(in millions of €)
2013
2012
Net profit from continuing operations
226
160
Add (substract):
Net (profit) loss from non-controlling interests
(4)
2
Elements considered in the underlying profit calculation
266
370
Non-recurring finance costs
—
19
Effect of the above items on income tax and non-controlling interests
(35)
(78)
Non-recurring income tax expense (benefit)
—
(47)
Underlying group share in net profit from continued operations
453
426
158
DELHAIZE GROUP ANNUAL REPORT 2013
FINANCIAL STATEMENTS