Food Lion 2013 Annual Report Download - page 34
Download and view the complete annual report
Please find page 34 of the 2013 Food Lion annual report below. You can navigate through the pages in the report by either clicking on the pages listed below, or by using the keyword search tool below to find specific information within the annual report.-
 1
1 -
2
-
3
-
4
-
5
-
6
-
7
-
8
-
9
-
10
-
11
-
12
-
13
-
14
-
15
-
16
-
17
-
18
-
19
-
20
-
21
-
22
-
23
-
 24
24 -
 25
25 -
 26
26 -
 27
27 -
 28
28 -
 29
29 -
 30
30 -
 31
31 -
 32
32 -
 33
33 -
 34
34 -
 35
35 -
 36
36 -
 37
37 -
 38
38 -
 39
39 -
 40
40 -
 41
41 -
 42
42 -
 43
43 -
 44
44 -
45
-
46
-
47
-
48
-
49
-
50
-
51
-
52
-
53
-
54
-
55
-
56
-
57
-
58
-
59
-
60
-
61
-
62
-
63
-
64
-
65
-
66
-
67
-
68
-
69
-
70
-
71
-
72
-
73
-
74
-
75
-
76
-
77
-
78
-
79
-
80
-
81
-
82
-
83
-
84
-
85
-
86
-
87
-
88
-
89
-
90
-
91
-
92
-
93
-
94
-
95
-
96
-
97
-
98
-
99
-
100
-
101
-
102
-
103
-
104
-
105
-
106
-
107
-
108
-
109
-
110
-
111
-
112
-
113
-
114
-
115
-
116
-
117
-
118
-
119
-
120
-
121
-
122
-
123
-
124
-
125
-
126
-
127
-
128
-
129
-
130
-
131
-
132
-
133
-
134
-
135
-
136
-
137
-
138
-
139
-
140
-
141
-
142
-
143
-
144
-
145
-
146
-
147
-
148
-
149
-
150
-
151
-
152
-
153
-
154
-
155
-
156
-
157
-
158
-
159
-
160
-
161
-
162
-
163
-
164
-
165
-
166
-
167
-
168
-
169
-
170
-
171
-
172
-
173
-
174
-
175
-
176
 |
 |

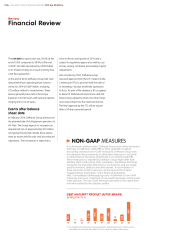
Financial Review
Review
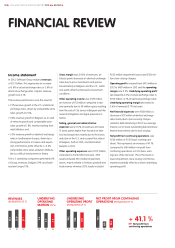
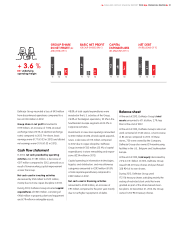
The net debt to equity ratio was 29.0% at the
end of 2013 compared to 39.9% at the end
of 2012. Net debt decreased by €599 million
to €1.5 billion mainly as a result of strong free
cash flow generation.
At the end of 2013, Delhaize Group had total
annual minimum operating lease commit-
ments for 2014 of €269 million, including
€21 million related to closed stores. These
leases generally have terms that range
between 1 and 45 years with renewal options
ranging from 3 to 30 years.
Events after balance
sheet date
In February 2014, Delhaize Group announced
the planned sale of its Bulgarian operations to
AP Mart. The Group expects to recognize an
impairment loss of approximately €10 million
and going forward will classify these opera-
tions as assets held for sale and discontinued
operations. The transaction is expected to
close in the second quarter of 2014 and is
subject to regulatory approval as well as cus-
tomary closing conditions and working capital
adjustments.
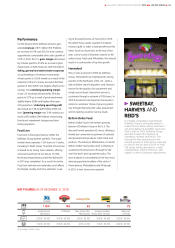
Also in February 2014, Delhaize Group
received approval from the U.S. Federal Trade
Commission (FTC) to proceed with the sale of
its Sweetbay, Harveys and Reid’s operations
to Bi-Lo. As part of the clearance, Bi-Lo agreed
to divest 12 Delhaize America stores and Del-
haize Group agreed to retain two other stores
and convert them into the Food Lion banner.
The final approval by the FTC will be issued
after a 30-day comment period.
NON-GAAP MEASURES
In its financial communication, Delhaize Group uses certain measures
that have no definition under IFRS or other generally accepted
accounting standards (non-GAAP measures). Delhaize Group does
not represent these measures as alternative measures to net profit
or other financial measures determined in accordance with IFRS.
These measures as reported by Delhaize Group might differ from
similarly titled measures by other companies. We believe that these
measures are important indicators for our business and are widely
used by investors, analysts and other parties. A reconciliation of
these measures to IFRS measures can be found in the chapter
“Supplementary Information” of the Financial Statements
(http://annualreport.delhaizegroup.com). A definition of non-GAAP
measures and ratios composed of non-GAAP measures can be found
in the glossary. The non-GAAP measures provided in this report have
not been audited by the statutory auditor.
DEBT MATURITY PROFILE(1) (AFTER SWAPS)
(IN MILLIONS OF €)
(1) Excluding finance leases; principal payments (related premiums and discounts
not taken into account) after effect of cross-currency interest rate swaps.
32
DELHAIZE GROUP ANNUAL REPORT 2013
REVIEW
15
1
14
211
18
400
16
7
17
326
27
51
19
225
20
400
31
202
40
600