Food Lion 2013 Annual Report Download - page 72
Download and view the complete annual report
Please find page 72 of the 2013 Food Lion annual report below. You can navigate through the pages in the report by either clicking on the pages listed below, or by using the keyword search tool below to find specific information within the annual report.-
 1
1 -
2
-
3
-
4
-
5
-
6
-
7
-
8
-
9
-
10
-
11
-
12
-
13
-
14
-
15
-
16
-
17
-
18
-
19
-
20
-
21
-
22
-
23
-
24
-
25
-
26
-
27
-
28
-
29
-
30
-
31
-
32
-
33
-
34
-
35
-
36
-
37
-
38
-
39
-
40
-
41
-
42
-
43
-
44
-
45
-
46
-
47
-
48
-
49
-
50
-
51
-
52
-
53
-
54
-
55
-
56
-
57
-
58
-
59
-
60
-
61
-
 62
62 -
 63
63 -
 64
64 -
 65
65 -
 66
66 -
 67
67 -
 68
68 -
 69
69 -
 70
70 -
 71
71 -
 72
72 -
 73
73 -
 74
74 -
 75
75 -
 76
76 -
 77
77 -
 78
78 -
 79
79 -
 80
80 -
 81
81 -
 82
82 -
83
-
84
-
85
-
86
-
87
-
88
-
89
-
90
-
91
-
92
-
93
-
94
-
95
-
96
-
97
-
98
-
99
-
100
-
101
-
102
-
103
-
104
-
105
-
106
-
107
-
108
-
109
-
110
-
111
-
112
-
113
-
114
-
115
-
116
-
117
-
118
-
119
-
120
-
121
-
122
-
123
-
124
-
125
-
126
-
127
-
128
-
129
-
130
-
131
-
132
-
133
-
134
-
135
-
136
-
137
-
138
-
139
-
140
-
141
-
142
-
143
-
144
-
145
-
146
-
147
-
148
-
149
-
150
-
151
-
152
-
153
-
154
-
155
-
156
-
157
-
158
-
159
-
160
-
161
-
162
-
163
-
164
-
165
-
166
-
167
-
168
-
169
-
170
-
171
-
172
-
173
-
174
-
175
-
176
 |
 |
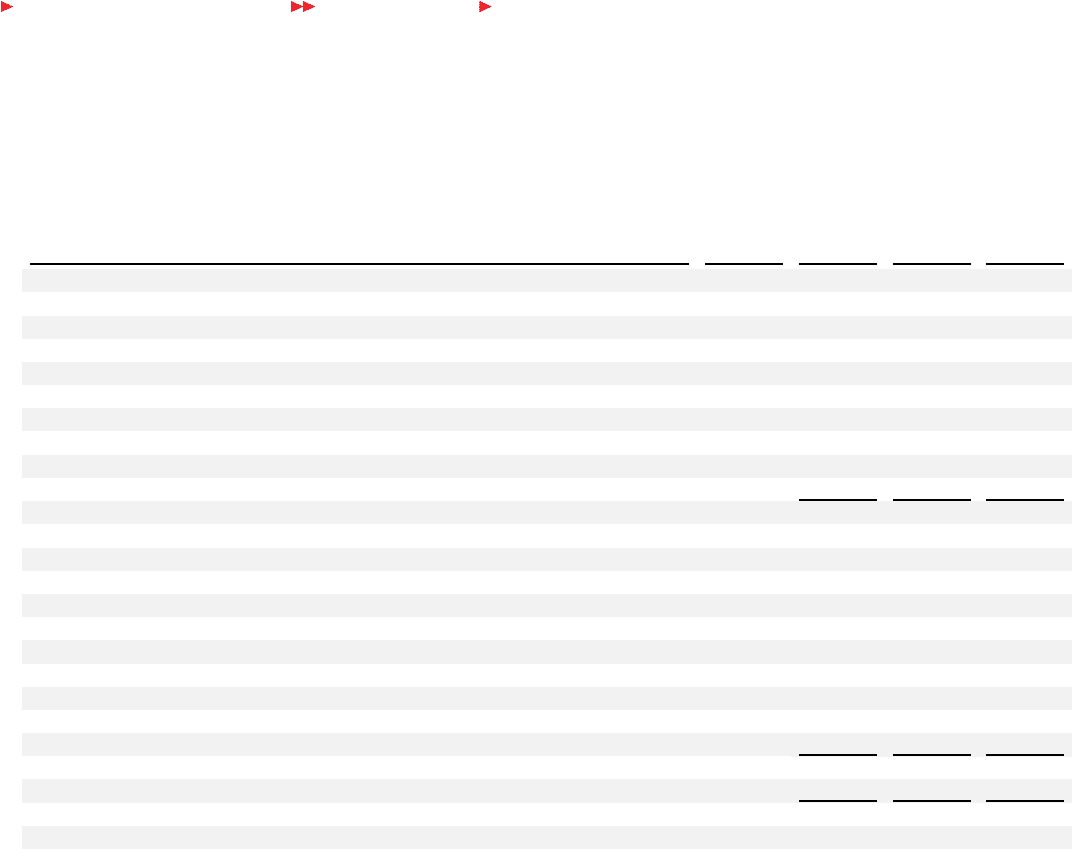
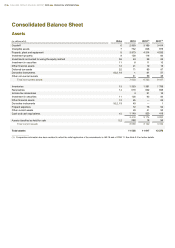
Consolidated Balance Sheet
Assets
(in millions of €)
Note
2013
2012(1)
2011(1)
Goodwill
6
2 959
3 189
3 414
Intangible assets
7
732
848
878
Property, plant and equipment
8
3 973
4 314
4 535
Investment property
9
100
116
83
Investments accounted for using the equity method
36
24
28
26
Investment in securities
11
8
11
13
Other financial assets
12
21
19
18
Deferred tax assets
22
71
89
97
Derivative instruments
10.2, 19
1
61
57
Other non-current assets
41
50
46
Total non-current assets
7 930
8 725
9 167
Inventories
13
1 353
1 391
1 709
Receivables
14
618
632
695
Income tax receivables
4
21
10
Investment in securities
11
126
93
93
Other financial assets
12
25
—
22
Derivative instruments
10.2, 19
40
—
1
Prepaid expenses
72
76
54
Other current assets
29
41
50
Cash and cash equivalents
15
1 149
920
419
3 416
3 174
3 053
Assets classified as held for sale
5.2
250
18
56
Total current assets
3 666
3 192
3 109
Total assets
11 596
11 917
12 276
_______________
(1) Comparative information has been restated to reflect the initial application of the amendments to IAS 19 and of IFRS 11. See Note 2.2 for further details.
70
DELHAIZE GROUP ANNUAL REPORT 2013
FINANCIAL STATEMENTS