Food Lion 2013 Annual Report Download - page 126
Download and view the complete annual report
Please find page 126 of the 2013 Food Lion annual report below. You can navigate through the pages in the report by either clicking on the pages listed below, or by using the keyword search tool below to find specific information within the annual report.-
 1
1 -
2
-
3
-
4
-
5
-
6
-
7
-
8
-
9
-
10
-
11
-
12
-
13
-
14
-
15
-
16
-
17
-
18
-
19
-
20
-
21
-
22
-
23
-
24
-
25
-
26
-
27
-
28
-
29
-
30
-
31
-
32
-
33
-
34
-
35
-
36
-
37
-
38
-
39
-
40
-
41
-
42
-
43
-
44
-
45
-
46
-
47
-
48
-
49
-
50
-
51
-
52
-
53
-
54
-
55
-
56
-
57
-
58
-
59
-
60
-
61
-
62
-
63
-
64
-
65
-
66
-
67
-
68
-
69
-
70
-
71
-
72
-
73
-
74
-
75
-
76
-
77
-
78
-
79
-
80
-
81
-
82
-
83
-
84
-
85
-
86
-
87
-
88
-
89
-
90
-
91
-
92
-
93
-
94
-
95
-
96
-
97
-
98
-
99
-
100
-
101
-
102
-
103
-
104
-
105
-
106
-
107
-
108
-
109
-
110
-
111
-
112
-
113
-
114
-
115
-
 116
116 -
 117
117 -
 118
118 -
 119
119 -
 120
120 -
 121
121 -
 122
122 -
 123
123 -
 124
124 -
 125
125 -
 126
126 -
 127
127 -
 128
128 -
 129
129 -
 130
130 -
 131
131 -
 132
132 -
 133
133 -
 134
134 -
 135
135 -
 136
136 -
137
-
138
-
139
-
140
-
141
-
142
-
143
-
144
-
145
-
146
-
147
-
148
-
149
-
150
-
151
-
152
-
153
-
154
-
155
-
156
-
157
-
158
-
159
-
160
-
161
-
162
-
163
-
164
-
165
-
166
-
167
-
168
-
169
-
170
-
171
-
172
-
173
-
174
-
175
-
176
 |
 |

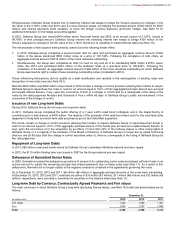
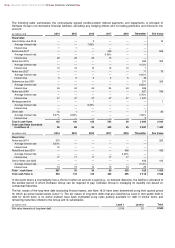
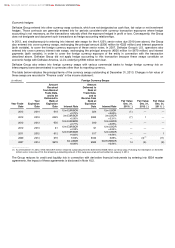
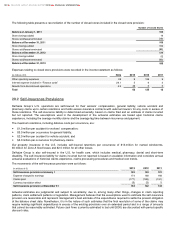
The following table summarizes the contractually agreed (undiscounted) interest payments and repayments of principal of
Delhaize Group’s non-derivative financial liabilities, excluding any hedging effects and not taking premiums and discounts into
account:
(in millions of $)
2014
2015
2016
2017
2018
Thereafter
Fair Value
Fixed rates
Senior Notes due 2016
—
—
9
—
—
—
10
Average interest rate
—
—
7.06%
—
—
—
Interest due
1
1
—
—
—
—
Bonds due 2017
—
—
—
450
—
—
509
Average interest rate
—
—
—
6.50%
—
—
Interest due
29
29
29
15
—
—
Notes due 2019
—
—
—
—
—
300
309
Average interest rate
—
—
—
—
—
4.13%
Interest due
12
12
12
12
12
7
Notes due 2027
—
—
—
—
—
71
78
Average interest rate
—
—
—
—
—
8.05%
Interest due
6
6
6
6
6
48
Debentures due 2031
—
—
—
—
—
271
328
Average interest rate
—
—
—
—
—
9.00%
Interest due
24
24
24
24
24
306
Notes due 2040
—
—
—
—
—
827
789
Average interest rate
—
—
—
—
—
5.70%
Interest due
47
47
47
47
47
1 037
Mortgage payable
—
—
1
—
—
—
1
Average interest rate
—
—
8.25%
—
—
—
Interest due
—
—
—
—
—
—
Other debt
12
1
—
—
—
7
20
Average interest rate
5.27%
0.00%
—
—
—
7.00%
Interest due
1
—
—
—
—
6
Total $ cash flows
132
120
128
554
89
2 880
2 044
Total cash flows translated
in millions of €
96
88
94
402
65
2 087
1 482
(in millions of €)
2014
2015
2016
2017
2018
Thereafter
Fair Value
Fixed rates
Notes due 2014
215
—
—
—
—
—
220
Average interest rate
5.63%
—
—
—
—
—
Interest due
12
—
—
—
—
—
Retail Bond due 2018
—
—
—
—
400
—
430
Average interest rate
—
—
—
—
4.25%
—
Interest due
17
17
17
17
17
—
Senior Notes due 2020
—
—
—
—
—
400
410
Average interest rate
—
—
—
—
—
3.13%
Interest due
13
13
13
13
13
25
Total € cash flows
257
30
30
30
430
425
1 060
Total cash flows in €
353
118
124
432
495
2 512
2 542
In the event where a counterparty has a choice of when an amount is paid (e.g., on demand deposits), the liability is allocated to
the earliest period in which Delhaize Group can be required to pay. Delhaize Group is managing its liquidity risk based on
contractual maturities.
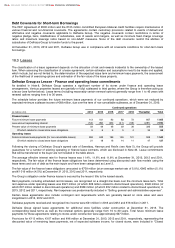
The fair values of the long-term debt (excluding finance leases, see Note 18.3) have been determined using their quoted prices
for which an active market exists (Level 1). The fair values of long-term debts that are classified as Level 2 (non-public debt or
debt for which there is no active market) have been estimated using rates publicly available for debt of similar terms and
remaining maturities offered to the Group and its subsidiaries.
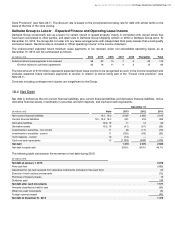
(in millions of
€)
Level 1
Level 2
Total
Fair value hierarchy of long-term debt
2 519
23
2 542
124
DELHAIZE GROUP ANNUAL REPORT 2013
FINANCIAL STATEMENTS