Food Lion 2013 Annual Report Download - page 107
Download and view the complete annual report
Please find page 107 of the 2013 Food Lion annual report below. You can navigate through the pages in the report by either clicking on the pages listed below, or by using the keyword search tool below to find specific information within the annual report.-
 1
1 -
2
-
3
-
4
-
5
-
6
-
7
-
8
-
9
-
10
-
11
-
12
-
13
-
14
-
15
-
16
-
17
-
18
-
19
-
20
-
21
-
22
-
23
-
24
-
25
-
26
-
27
-
28
-
29
-
30
-
31
-
32
-
33
-
34
-
35
-
36
-
37
-
38
-
39
-
40
-
41
-
42
-
43
-
44
-
45
-
46
-
47
-
48
-
49
-
50
-
51
-
52
-
53
-
54
-
55
-
56
-
57
-
58
-
59
-
60
-
61
-
62
-
63
-
64
-
65
-
66
-
67
-
68
-
69
-
70
-
71
-
72
-
73
-
74
-
75
-
76
-
77
-
78
-
79
-
80
-
81
-
82
-
83
-
84
-
85
-
86
-
87
-
88
-
89
-
90
-
91
-
92
-
93
-
94
-
95
-
96
-
 97
97 -
 98
98 -
 99
99 -
 100
100 -
 101
101 -
 102
102 -
 103
103 -
 104
104 -
 105
105 -
 106
106 -
 107
107 -
 108
108 -
 109
109 -
 110
110 -
 111
111 -
 112
112 -
 113
113 -
 114
114 -
 115
115 -
 116
116 -
 117
117 -
118
-
119
-
120
-
121
-
122
-
123
-
124
-
125
-
126
-
127
-
128
-
129
-
130
-
131
-
132
-
133
-
134
-
135
-
136
-
137
-
138
-
139
-
140
-
141
-
142
-
143
-
144
-
145
-
146
-
147
-
148
-
149
-
150
-
151
-
152
-
153
-
154
-
155
-
156
-
157
-
158
-
159
-
160
-
161
-
162
-
163
-
164
-
165
-
166
-
167
-
168
-
169
-
170
-
171
-
172
-
173
-
174
-
175
-
176
 |
 |

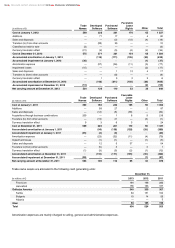
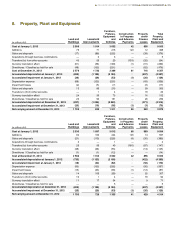
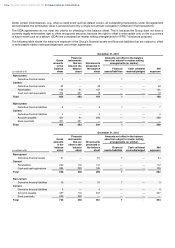
8. Property, Plant and Equipment
(in millions of €)
Land and
Buildings
Leasehold
Improvements
Furniture,
Fixtures,
Equipment
and
Vehicles
Construction
in Progress
and Advance
Payments
Property
under
Finance
Leases
Total
Property,
Plant and
Equipment
Cost at January 1, 2013
2 586
1 914
3 602
42
856
9 000
Additions
76
71
216
123
12
498
Sales and disposals
(17)
(88)
(232)
—
(39)
(376)
Acquisitions through business combinations
—
2
3
—
—
5
Transfers (to) from other accounts
43
26
20
(103)
(20)
(34)
Currency translation effect
(61)
(58)
(109)
(1)
(31)
(260)
Divestitures / Classified as held for sale
(48)
(135)
(231)
—
(62)
(476)
Cost at December 31, 2013
2 579
1 732
3 269
61
716
8 357
Accumulated depreciation at January 1, 2013
(800)
(1 156)
(2 194)
—
(407)
(4 557)
Accumulated impairment at January 1, 2013
(26)
(29)
(53)
(1)
(20)
(129)
Depreciation expense
(88)
(122)
(255)
—
(43)
(508)
Impairment losses
(2)
(5)
(7)
—
(3)
(17)
Sales and disposals
15
86
213
—
39
353
Transfers to (from) other accounts
—
1
4
—
18
23
Currency translation effect
24
39
73
—
16
152
Divestitures / Classified as held for sale
20
92
161
—
26
299
Accumulated depreciation at December 31, 2013
(837)
(1 084)
(2 022)
—
(371)
(4 314)
Accumulated impairment at December 31, 2013
(20)
(10)
(36)
(1)
(3)
(70)
Net carrying amount at December 31, 2013
1 722
638
1 211
60
342
3 973
(in millions of €)
Land and
Buildings
Leasehold
Improvements
Furniture,
Fixtures,
Equipment
and
Vehicles
Construction
in Progress
and Advance
Payments
Property
under
Finance
Leases
Total
Property,
Plant and
Equipment
Cost at January 1, 2012
2 530
1 897
3 612
86
969
9 094
Additions
94
100
244
145
14
597
Sales and disposals
(21)
(110)
(228)
(4)
(26)
(389)
Acquisitions through business combinations
3
—
1
—
—
4
Transfers (to) from other accounts
29
56
40
(185)
(87)
(147)
Currency translation effect
(48)
(28)
(55)
—
(14)
(145)
Divestitures / Classified as held for sale
(1)
(1)
(12)
—
—
(14)
Cost at December 31, 2012
2 586
1 914
3 602
42
856
9 000
Accumulated depreciation at January 1, 2012
(735)
(1 123)
(2 109)
—
(422)
(4 389)
Accumulated impairment at January 1, 2012
(18)
(34)
(62)
—
(56)
(170)
Depreciation expense
(93)
(132)
(292)
—
(50)
(567)
Impairment losses
(15)
(23)
(36)
(1)
(12)
(87)
Sales and disposals
14
109
209
—
25
357
Transfers to (from) other accounts
10
1
4
—
79
94
Currency translation effect
11
17
34
—
9
71
Divestitures / Classified as held for sale
—
—
5
—
—
5
Accumulated depreciation at December 31, 2012
(800)
(1 156)
(2 194)
—
(407)
(4 557)
Accumulated impairment at December 31, 2012
(26)
(29)
(53)
(1)
(20)
(129)
Net carrying amount at December 31, 2012
1 760
729
1 355
41
429
4 314
DELHAIZE GROUP ANNUAL REPORT 2013 FINANCIAL STATEMENTS
105