Food Lion 2013 Annual Report Download - page 108
Download and view the complete annual report
Please find page 108 of the 2013 Food Lion annual report below. You can navigate through the pages in the report by either clicking on the pages listed below, or by using the keyword search tool below to find specific information within the annual report.-
 1
1 -
2
-
3
-
4
-
5
-
6
-
7
-
8
-
9
-
10
-
11
-
12
-
13
-
14
-
15
-
16
-
17
-
18
-
19
-
20
-
21
-
22
-
23
-
24
-
25
-
26
-
27
-
28
-
29
-
30
-
31
-
32
-
33
-
34
-
35
-
36
-
37
-
38
-
39
-
40
-
41
-
42
-
43
-
44
-
45
-
46
-
47
-
48
-
49
-
50
-
51
-
52
-
53
-
54
-
55
-
56
-
57
-
58
-
59
-
60
-
61
-
62
-
63
-
64
-
65
-
66
-
67
-
68
-
69
-
70
-
71
-
72
-
73
-
74
-
75
-
76
-
77
-
78
-
79
-
80
-
81
-
82
-
83
-
84
-
85
-
86
-
87
-
88
-
89
-
90
-
91
-
92
-
93
-
94
-
95
-
96
-
97
-
 98
98 -
 99
99 -
 100
100 -
 101
101 -
 102
102 -
 103
103 -
 104
104 -
 105
105 -
 106
106 -
 107
107 -
 108
108 -
 109
109 -
 110
110 -
 111
111 -
 112
112 -
 113
113 -
 114
114 -
 115
115 -
 116
116 -
 117
117 -
 118
118 -
119
-
120
-
121
-
122
-
123
-
124
-
125
-
126
-
127
-
128
-
129
-
130
-
131
-
132
-
133
-
134
-
135
-
136
-
137
-
138
-
139
-
140
-
141
-
142
-
143
-
144
-
145
-
146
-
147
-
148
-
149
-
150
-
151
-
152
-
153
-
154
-
155
-
156
-
157
-
158
-
159
-
160
-
161
-
162
-
163
-
164
-
165
-
166
-
167
-
168
-
169
-
170
-
171
-
172
-
173
-
174
-
175
-
176
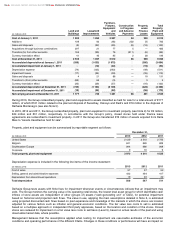
 |
 |
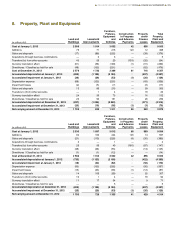
(in millions of €)
Land and
Buildings
Leasehold
Improvements
Furniture,
Fixtures,
Equipment
and
Vehicles
Construction
in Progress
and Advance
Payments
Property
under
Finance
Leases
Total
Property,
Plant and
Equipment
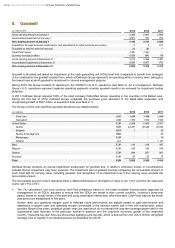
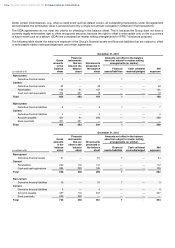
Cost at January 1, 2011
1 926
1 856
3 207
94
930
8 013
Additions
109
92
262
202
35
700
Sales and disposals
(8)
(22)
(95)
(6)
(18)
(149)
Acquisitions through business combinations
297
21
77
5
—
400
Transfers (to) from other accounts
165
(90)
76
(211)
(6)
(66)
Currency translation effect
41
40
85
2
28
196
Cost at December 31, 2011
2 530
1 897
3 612
86
969
9 094
Accumulated depreciation at January 1, 2011
(586)
(1 053)
(1 875)
—
(380)
(3 894)
Accumulated impairment at January 1, 2011
—
(12)
(22)
—
(19)
(53)
Depreciation expense
(74)
(125)
(263)
—
(49)
(511)
Impairment losses
(17)
(24)
(39)
—
(35)
(115)
Sales and disposals
4
21
88
—
18
131
Transfers to (from) other accounts
(60)
65
(3)
—
3
5
Currency translation effect
(20)
(29)
(57)
—
(16)
(122)
Accumulated depreciation at December 31, 2011
(735)
(1 123)
(2 109)
—
(422)
(4 389)
Accumulated impairment at December 31, 2011
(18)
(34)
(62)
—
(56)
(170)
Net carrying amount at December 31, 2011
1 777
740
1 441
86
491
4 535
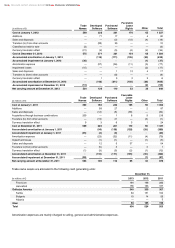
During 2013, the Group reclassified property, plant and equipment to assets classified as held for sale for a total amount of €177
million, of which €161 million related to the planned disposal of Sweetbay, Harveys and Reid’s and €16 million to the disposal of
Delhaize Montenegro (see also Note 5).
In 2013, 2012 and 2011, the Group reclassified property, plant and equipment to investment property (see Note 9) for €2 million,
€44 million and €31 million, respectively. In accordance with the Group’s policy, closed stores held under finance lease
agreements are reclassified to investment property. In 2011 the Group also transferred €16 million of assets acquired from Delta
Maxi to “Assets classified as held for sale”.
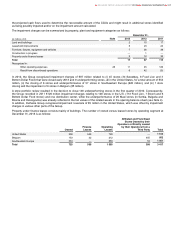
Property, plant and equipment can be summarized by reportable segment as follows:
(in millions of €)
December 31,
2013
2012
2011
United States
2 129
2 510
2 750
Belgium
841
828
808
Southeastern Europe
994
966
968
Corporate
9
10
9
Total property, plant and equipment
3 973
4 314
4 535
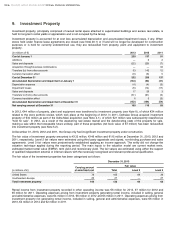
Depreciation expense is included in the following line items of the income statement:
(in millions of
€)
2013
2012
2011
Cost of sales
57
57
52
Selling, general and administrative expenses
432
464
417
Depreciation from discontinued operations
19
46
42
Total depreciation
508
567
511
Delhaize Group tests assets with finite lives for impairment whenever events or circumstances indicate that an impairment may
exist. The Group monitors the carrying value of its operating retail stores, the lowest level asset group for which identifiable cash
inflows of store assets are independent of other (groups of) assets (“cash-generating unit” or CGU), for potential impairment
based on historical and projected cash flows. The value in use, applying the main assumptions detailed in Note 6, is estimated
using projected discounted cash flows based on past experience and knowledge of the markets in which the stores are located,
adjusted for various factors such as inflation and general economic conditions. The fair value less costs to sell is estimated
based on a multiples approach or independent third party appraisals, based on the location and condition of the stores. Closed
stores are reviewed for impairment on a fair value less costs to sell basis (Level 3), based on actual results of the past and using
observable market data, where possible.
Management believes that the assumptions applied when testing for impairment are reasonable estimates of the economic
conditions and operating performance of the different CGUs. Changes in these conditions or performance will have an impact on
106
DELHAIZE GROUP ANNUAL REPORT 2013
FINANCIAL STATEMENTS