Food Lion 2013 Annual Report Download - page 111
Download and view the complete annual report
Please find page 111 of the 2013 Food Lion annual report below. You can navigate through the pages in the report by either clicking on the pages listed below, or by using the keyword search tool below to find specific information within the annual report.-
 1
1 -
2
-
3
-
4
-
5
-
6
-
7
-
8
-
9
-
10
-
11
-
12
-
13
-
14
-
15
-
16
-
17
-
18
-
19
-
20
-
21
-
22
-
23
-
24
-
25
-
26
-
27
-
28
-
29
-
30
-
31
-
32
-
33
-
34
-
35
-
36
-
37
-
38
-
39
-
40
-
41
-
42
-
43
-
44
-
45
-
46
-
47
-
48
-
49
-
50
-
51
-
52
-
53
-
54
-
55
-
56
-
57
-
58
-
59
-
60
-
61
-
62
-
63
-
64
-
65
-
66
-
67
-
68
-
69
-
70
-
71
-
72
-
73
-
74
-
75
-
76
-
77
-
78
-
79
-
80
-
81
-
82
-
83
-
84
-
85
-
86
-
87
-
88
-
89
-
90
-
91
-
92
-
93
-
94
-
95
-
96
-
97
-
98
-
99
-
100
-
 101
101 -
 102
102 -
 103
103 -
 104
104 -
 105
105 -
 106
106 -
 107
107 -
 108
108 -
 109
109 -
 110
110 -
 111
111 -
 112
112 -
 113
113 -
 114
114 -
 115
115 -
 116
116 -
 117
117 -
 118
118 -
 119
119 -
 120
120 -
 121
121 -
122
-
123
-
124
-
125
-
126
-
127
-
128
-
129
-
130
-
131
-
132
-
133
-
134
-
135
-
136
-
137
-
138
-
139
-
140
-
141
-
142
-
143
-
144
-
145
-
146
-
147
-
148
-
149
-
150
-
151
-
152
-
153
-
154
-
155
-
156
-
157
-
158
-
159
-
160
-
161
-
162
-
163
-
164
-
165
-
166
-
167
-
168
-
169
-
170
-
171
-
172
-
173
-
174
-
175
-
176
 |
 |

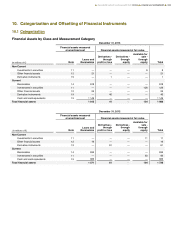
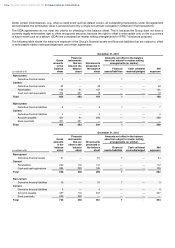
10. Categorization and Offsetting of Financial Instruments
10.1 Categorization
Financial Assets by Class and Measurement Category
(in millions of €)
December 31, 2013
Financial assets measured
at amortized cost Financial assets measured at fair value
Note
Loans and
Receivables
Derivatives -
through
profit or loss
Derivatives -
through
equity
Available for
sale -
through
equity Total
Non-Current
Investments in securities
11
—
—
—
8
8
Other financial assets
12
21
—
—
—
21
Derivative instruments
19
—
1
—
—
1
Current
Receivables
14
618
—
—
—
618
Investments in securities
11
—
—
—
126
126
Other financial assets
12
25
—
—
—
25
Derivative instruments
19
—
40
—
—
40
Cash and cash equivalents
15
1 149
—
—
—
1 149
Total financial assets
1 813
41
—
134
1 988
(in millions of €)
December 31, 2012
Financial assets measured
at amortized cost Financial assets measured at fair value
Note
Loans and
Receivables
Derivatives -
through
profit or loss
Derivatives -
through
equity
Available for
sale -
through
equity Total
Non-Current
Investments in securities
11
—
—
—
11
11
Other financial assets
12
19
—
—
—
19
Derivative instruments
19
—
61
—
—
61
Current
Receivables
14
632
—
—
—
632
Investments in securities
11
—
—
—
93
93
Cash and cash equivalents
15
920
—
—
—
920
Total financial assets
1 571
61
—
104
1 736
DELHAIZE GROUP ANNUAL REPORT 2013 FINANCIAL STATEMENTS
109