Food Lion 2013 Annual Report Download - page 130
Download and view the complete annual report
Please find page 130 of the 2013 Food Lion annual report below. You can navigate through the pages in the report by either clicking on the pages listed below, or by using the keyword search tool below to find specific information within the annual report.-
 1
1 -
2
-
3
-
4
-
5
-
6
-
7
-
8
-
9
-
10
-
11
-
12
-
13
-
14
-
15
-
16
-
17
-
18
-
19
-
20
-
21
-
22
-
23
-
24
-
25
-
26
-
27
-
28
-
29
-
30
-
31
-
32
-
33
-
34
-
35
-
36
-
37
-
38
-
39
-
40
-
41
-
42
-
43
-
44
-
45
-
46
-
47
-
48
-
49
-
50
-
51
-
52
-
53
-
54
-
55
-
56
-
57
-
58
-
59
-
60
-
61
-
62
-
63
-
64
-
65
-
66
-
67
-
68
-
69
-
70
-
71
-
72
-
73
-
74
-
75
-
76
-
77
-
78
-
79
-
80
-
81
-
82
-
83
-
84
-
85
-
86
-
87
-
88
-
89
-
90
-
91
-
92
-
93
-
94
-
95
-
96
-
97
-
98
-
99
-
100
-
101
-
102
-
103
-
104
-
105
-
106
-
107
-
108
-
109
-
110
-
111
-
112
-
113
-
114
-
115
-
116
-
117
-
118
-
119
-
 120
120 -
 121
121 -
 122
122 -
 123
123 -
 124
124 -
 125
125 -
 126
126 -
 127
127 -
 128
128 -
 129
129 -
 130
130 -
 131
131 -
 132
132 -
 133
133 -
 134
134 -
 135
135 -
 136
136 -
 137
137 -
 138
138 -
 139
139 -
 140
140 -
141
-
142
-
143
-
144
-
145
-
146
-
147
-
148
-
149
-
150
-
151
-
152
-
153
-
154
-
155
-
156
-
157
-
158
-
159
-
160
-
161
-
162
-
163
-
164
-
165
-
166
-
167
-
168
-
169
-
170
-
171
-
172
-
173
-
174
-
175
-
176
 |
 |
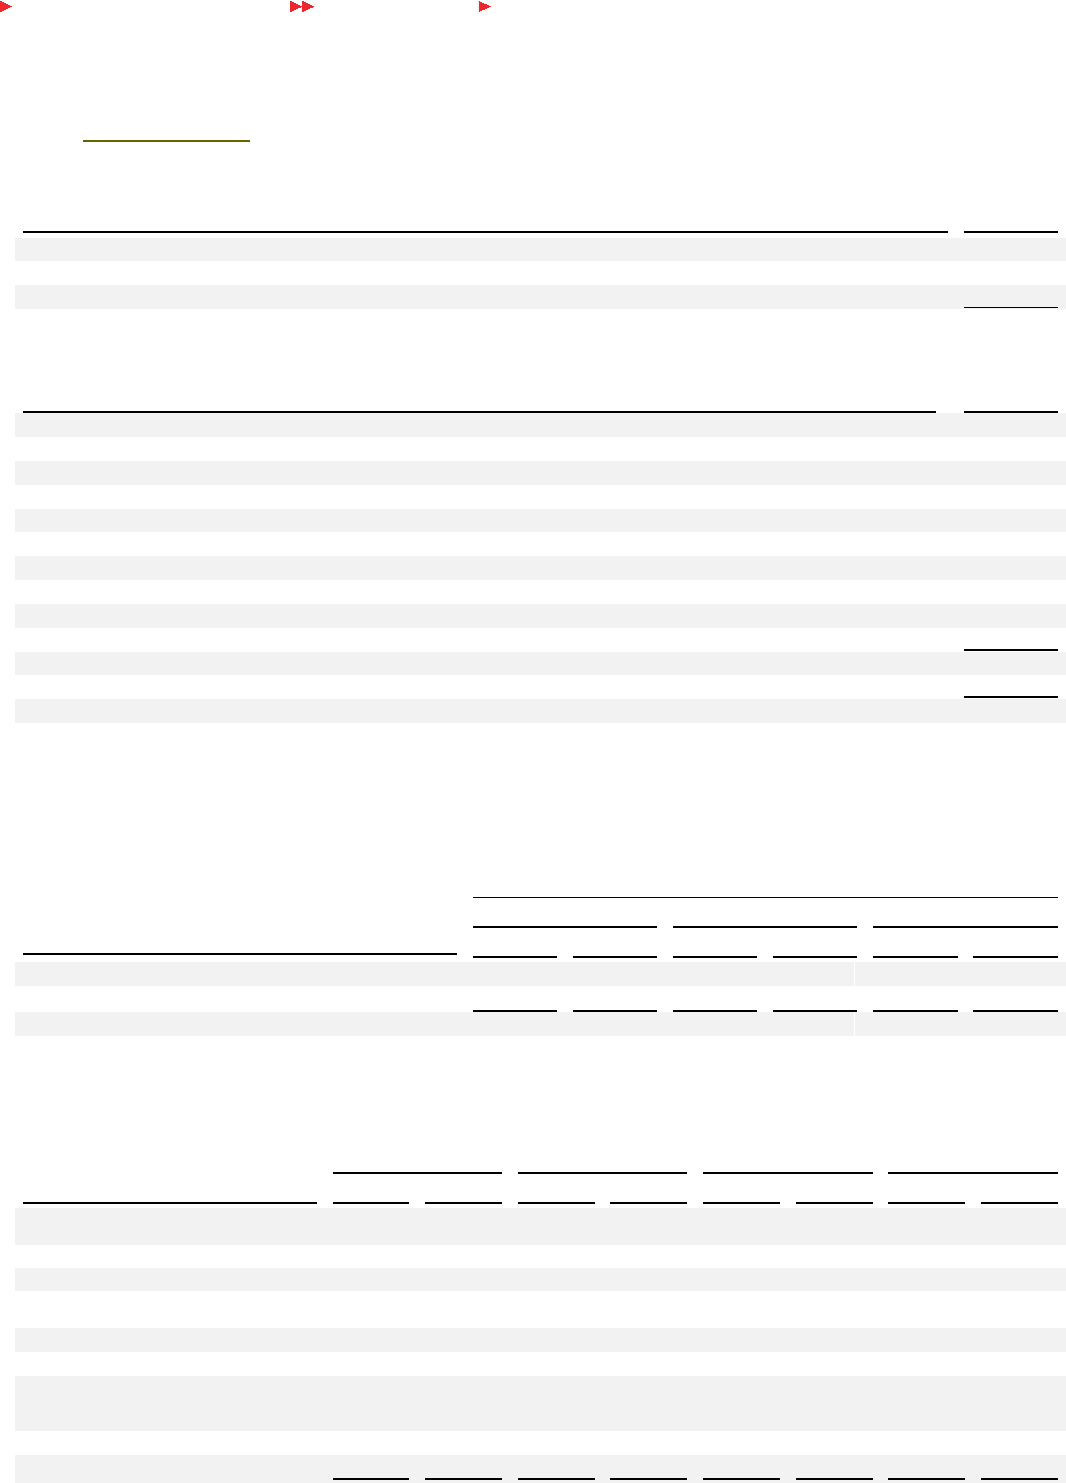
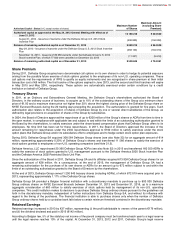
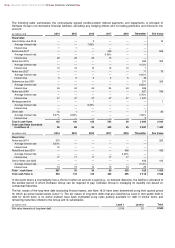
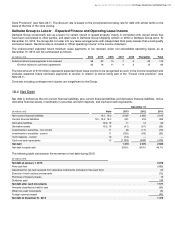
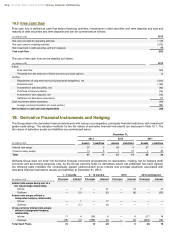
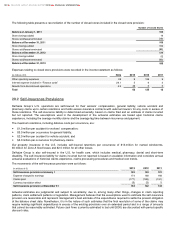
18.5 Free cash flow
Free cash flow is defined as cash flow before financing activities, investments in debt securities and term deposits and sale and
maturity of debt securities and term deposits and can be summarized as follows:
(in millions of €)
2013
Net cash provided by operating activities
1 185
Net cash used in investing activities
(572)
Net investment in debt securities and term deposits
56
Free cash flow
669
The use of free cash flow can be detailed as follows:
(in millions of €)
2013
Inflow:
Free cash flow
669
Proceeds from the exercise of share warrants and stock options
12
Outflow:
Repayments of long-term loans (including lease obligations), net
(213)
Dividends paid
(142)
Investment in debt securities, net
(43)
Purchase of treasury shares
(15)
Investment in term deposits, net
(13)
Settlement of derivative instruments
(1)
Cash movement before translation
254
Foreign currency translation (on cash portion)
(28)
Net increase in cash and cash equivalents
226
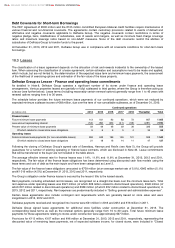
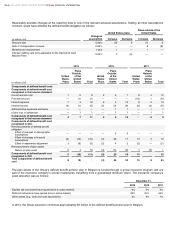
19. Derivative Financial Instruments and Hedging
The Group enters into derivative financial instruments with various counterparties, principally financial institutions with investment
grade credit ratings. The valuation methods for the fair values of derivative financial instruments are disclosed in Note 10.1. The
fair values of derivative assets and liabilities are summarized below:
December 31,
2013
2012
2011
(in millions of €)
Assets
Liabilities
Assets
Liabilities
Assets
Liabilities
Interest rate swaps
27
3
60
4
57
—
Cross-currency swaps
14
8
1
10
1
20
Total
41
11
61
14
58
20
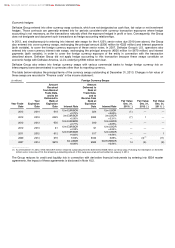
Delhaize Group does not enter into derivative financial instrument arrangements for speculation / trading, but for hedging (both
economic and accounting) purposes only. As the Group currently holds no derivatives where net settlement has been agreed,
the following table indicates the contractually agreed (undiscounted) gross interest and principal payments associated with
derivative financial instruments (assets and liabilities) at December 31, 2013:
(in millions of €)
1 - 3 months
4 - 12 months
2015
2016 and beyond
Principal
Interest
Principal
Interest
Principal
Interest
Principal
Interest
Interest rate swaps being part of a
fair value hedge relationship
Inflows
—
3
—
21
—
12
—
47
Outflows
—
(3)
—
(6)
—
(8)
—
(29)
Interest rate swaps without a
designated hedging relationship
Inflows
—
1
—
17
—
—
—
—
Outflows
—
(1)
—
(4)
—
—
—
—
Cross-currency interest rate swaps
without a designated hedging
relationship
Inflows
17
4
500
6
—
6
217
19
Outflows
(18)
(4)
(486)
(5)
—
(5)
(225)
(18)
Total Cash Flows
(1)
—
14
29
—
5
(8)
19
128
DELHAIZE GROUP ANNUAL REPORT 2013
FINANCIAL STATEMENTS