Food Lion 2013 Annual Report Download - page 109
Download and view the complete annual report
Please find page 109 of the 2013 Food Lion annual report below. You can navigate through the pages in the report by either clicking on the pages listed below, or by using the keyword search tool below to find specific information within the annual report.-
 1
1 -
2
-
3
-
4
-
5
-
6
-
7
-
8
-
9
-
10
-
11
-
12
-
13
-
14
-
15
-
16
-
17
-
18
-
19
-
20
-
21
-
22
-
23
-
24
-
25
-
26
-
27
-
28
-
29
-
30
-
31
-
32
-
33
-
34
-
35
-
36
-
37
-
38
-
39
-
40
-
41
-
42
-
43
-
44
-
45
-
46
-
47
-
48
-
49
-
50
-
51
-
52
-
53
-
54
-
55
-
56
-
57
-
58
-
59
-
60
-
61
-
62
-
63
-
64
-
65
-
66
-
67
-
68
-
69
-
70
-
71
-
72
-
73
-
74
-
75
-
76
-
77
-
78
-
79
-
80
-
81
-
82
-
83
-
84
-
85
-
86
-
87
-
88
-
89
-
90
-
91
-
92
-
93
-
94
-
95
-
96
-
97
-
98
-
 99
99 -
 100
100 -
 101
101 -
 102
102 -
 103
103 -
 104
104 -
 105
105 -
 106
106 -
 107
107 -
 108
108 -
 109
109 -
 110
110 -
 111
111 -
 112
112 -
 113
113 -
 114
114 -
 115
115 -
 116
116 -
 117
117 -
 118
118 -
 119
119 -
120
-
121
-
122
-
123
-
124
-
125
-
126
-
127
-
128
-
129
-
130
-
131
-
132
-
133
-
134
-
135
-
136
-
137
-
138
-
139
-
140
-
141
-
142
-
143
-
144
-
145
-
146
-
147
-
148
-
149
-
150
-
151
-
152
-
153
-
154
-
155
-
156
-
157
-
158
-
159
-
160
-
161
-
162
-
163
-
164
-
165
-
166
-
167
-
168
-
169
-
170
-
171
-
172
-
173
-
174
-
175
-
176
 |
 |

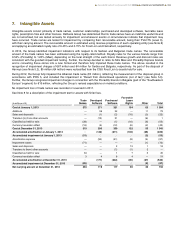
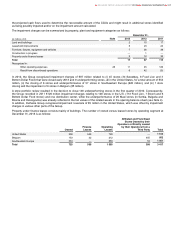
the projected cash flows used to determine the recoverable amount of the CGUs and might result in additional stores identified
as being possibly impaired and/or on the impairment amount calculated.
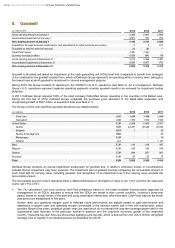
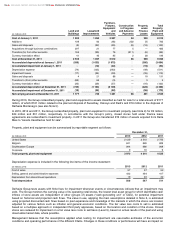
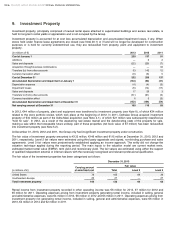
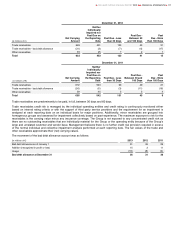
The impairment charges can be summarized by property, plant and equipment categories as follows:
(in millions of
€)
December 31,
Note
2013
2012
2011
Land and buildings
2
15
17
Leasehold improvements
5
23
24
Furniture, fixtures, equipment and vehicles
7
36
39
Construction in progress
—
1
—
Property under finance leases
3
12
35
Total
17
87
115
Recognized in :
Other operating expenses
28
11
45
120
Result from discontinued operations
6
42
(5)
In 2012, the Group recognized impairment charges of €87 million related to (i) 45 stores (34 Sweetbay, 8 Food Lion and 3
Bottom Dollar Food) that were closed early 2013 and 9 underperforming stores, all in the United States, for a total amount of €54
million, (ii) the closing of 6 stores and underperformance of 57 stores in Southeastern Europe (€28 million), and (iii) 1 store
closing and the impairment of 6 stores in Belgium (€5 million).
A store portfolio review resulted in the decision to close 146 underperforming stores in the first quarter of 2012. Consequently,
the Group recorded in 2011 €120 million impairment charges relating to 126 stores in the U.S. (113 Food Lion, 7 Bloom and 6
Bottom Dollar Food stores) and one distribution center, while the underperformance of 20 Maxi stores (in Serbia, Bulgaria and
Bosnia and Herzegovina) was already reflected in the fair values of the related assets in the opening balance sheet (see Note 4).
In addition, Delhaize Group recognized impairment reversals of €5 million in the United States, which was offset by impairment
charges in various other parts of the Group.
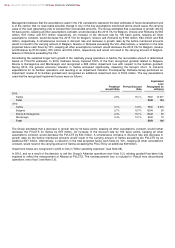
Property under finance leases consists mainly of buildings. The number of owned versus leased stores by operating segment at
December 31, 2013 is as follows:
Owned
Finance
Leases
Operating
Leases
Affiliated and Franchised
Stores Owned by their
Operators or Directly Leased
by their Operators from a
Third Party Total
United States
238
556
720
—
1 514
Belgium
153
32
212
455
852
Southeastern Europe
334
—
663
54
1 051
Total
725
588
1 595
509
3 417
DELHAIZE GROUP ANNUAL REPORT 2013 FINANCIAL STATEMENTS
107