Food Lion 2013 Annual Report Download - page 115
Download and view the complete annual report
Please find page 115 of the 2013 Food Lion annual report below. You can navigate through the pages in the report by either clicking on the pages listed below, or by using the keyword search tool below to find specific information within the annual report.-
 1
1 -
2
-
3
-
4
-
5
-
6
-
7
-
8
-
9
-
10
-
11
-
12
-
13
-
14
-
15
-
16
-
17
-
18
-
19
-
20
-
21
-
22
-
23
-
24
-
25
-
26
-
27
-
28
-
29
-
30
-
31
-
32
-
33
-
34
-
35
-
36
-
37
-
38
-
39
-
40
-
41
-
42
-
43
-
44
-
45
-
46
-
47
-
48
-
49
-
50
-
51
-
52
-
53
-
54
-
55
-
56
-
57
-
58
-
59
-
60
-
61
-
62
-
63
-
64
-
65
-
66
-
67
-
68
-
69
-
70
-
71
-
72
-
73
-
74
-
75
-
76
-
77
-
78
-
79
-
80
-
81
-
82
-
83
-
84
-
85
-
86
-
87
-
88
-
89
-
90
-
91
-
92
-
93
-
94
-
95
-
96
-
97
-
98
-
99
-
100
-
101
-
102
-
103
-
104
-
 105
105 -
 106
106 -
 107
107 -
 108
108 -
 109
109 -
 110
110 -
 111
111 -
 112
112 -
 113
113 -
 114
114 -
 115
115 -
 116
116 -
 117
117 -
 118
118 -
 119
119 -
 120
120 -
 121
121 -
 122
122 -
 123
123 -
 124
124 -
 125
125 -
126
-
127
-
128
-
129
-
130
-
131
-
132
-
133
-
134
-
135
-
136
-
137
-
138
-
139
-
140
-
141
-
142
-
143
-
144
-
145
-
146
-
147
-
148
-
149
-
150
-
151
-
152
-
153
-
154
-
155
-
156
-
157
-
158
-
159
-
160
-
161
-
162
-
163
-
164
-
165
-
166
-
167
-
168
-
169
-
170
-
171
-
172
-
173
-
174
-
175
-
176
 |
 |

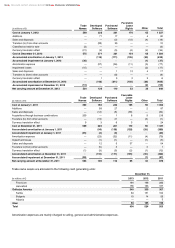
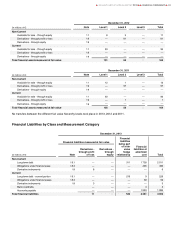
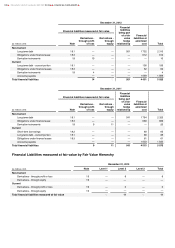
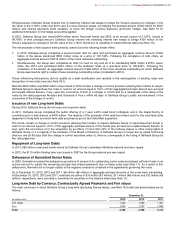
December 31, 2012
(in millions of €)
Note
Level 1
Level 2
Level 3
Total
Non-Current
Derivatives - through profit or loss
19
—
10
—
10
Derivatives - through equity
19
—
—
—
—
Current
Derivatives - through profit or loss
19
—
4
—
4
Derivatives - through equity
19
—
—
—
—
Total financial liabilities measured at fair value
—
14
—
14
December 31, 2011
(in millions of €)
Note
Level 1
Level 2
Level 3
Total
Non-Current
Derivatives - through profit or loss
19
—
9
—
9
Derivatives - through equity
19
—
11
—
11
Current
Derivatives - through profit or loss
19
—
—
—
—
Derivatives - through equity
19
—
—
—
—
Total financial liabilities measured at fair value
—
20
—
20
During 2013, 2012 and 2011, no transfers between the different fair value hierarchy levels took place.
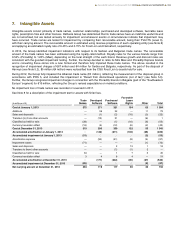
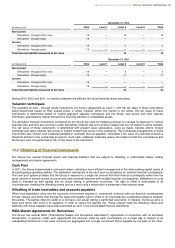
Valuation techniques
The available for sale – through equity instruments are mainly categorized as Level 1, with the fair value of these instruments
being determined based on their quoted prices in active markets. When the market is not active, the fair value of these
instruments is determined based on market approach valuation techniques and the Group uses prices and other relevant
information generated by market transactions involving identical or comparable assets.
The derivative financial instruments contracted by the Group are used for hedging purposes to manage its exposure to various
financial risks and they are over-the-counter derivatives (interest rate and currency swaps) that are not traded in active markets.
The fair value of these instruments is determined with present value calculations, using as inputs, besides others, foreign
exchange spot rates, interest rate curves or implicit forward rate curves of the underlying. The contractual arrangements of these
instruments also include cash collateral (pledged or received) that are payable / receivable if the value of a derivate exceeds a
threshold defined in the contractual provisions. Such cash collaterals materially reduce the impact of both the counterparty and
the Group’s own non-performance risk on the value of the instrument.
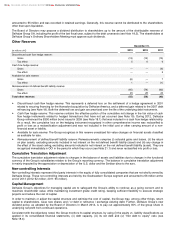
10.2 Offsetting of Financial Instruments
The Group has several financial assets and financial liabilities that are subject to offsetting or enforceable master netting
arrangements and similar agreements.
Cash Pool
In 2011, the Group implemented a cash pool system, allowing a more efficient management of the daily working capital needs of
the participating operating entities. The settlement mechanism of the cash pool is provided by an external financial counterparty.
The cash pool system provides that the Group is exposed to a single net amount with that financial counterparty rather than the
gross amount of several current accounts and bank overdraft balances with multiple financial counterparties. Settlement on a net
basis is intended by both parties and an actual netting is performed recurrently. The right to offset is enforceable in all
circumstances, meeting the offsetting criteria and as a result only a net position is presented in the balance sheet.
Offsetting of trade receivables and accounts payables
When local legislations allow and the economic environment requires it, commercial contracts with non-financial counterparties
include clauses and terms that provide the legal enforceable right to offset in all circumstances outstanding balances between
the parties. The parties intend to settle on a net basis and actual netting is performed recurrently. In Greece, the Group aims to
have such terms with most of its suppliers, in order to reduce the liquidity risk. These clauses meet the offsetting criteria and
balances with these suppliers have been presented as such in the consolidated financial statements.
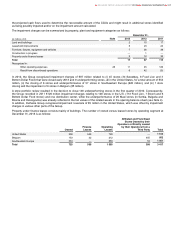
ISDA Master Agreements for Derivatives
The Group has several ISDA (“International Swaps and Derivatives Association”) agreements in connection with its derivative
transactions. In general, under such agreements the amounts owed by each counterparty on a single day in respect of all
outstanding transactions in the same currency are aggregated into a single net amount that is payable by one party to the other.
DELHAIZE GROUP ANNUAL REPORT 2013 FINANCIAL STATEMENTS
113