Entergy 2006 Annual Report Download - page 73
Download and view the complete annual report
Please find page 73 of the 2006 Entergy annual report below. You can navigate through the pages in the report by either clicking on the pages listed below, or by using the keyword search tool below to find specific information within the annual report.-
 1
1 -
2
-
3
-
4
-
5
-
6
-
7
-
8
-
9
-
10
-
11
-
12
-
13
-
14
-
15
-
16
-
17
-
18
-
19
-
20
-
21
-
22
-
23
-
24
-
25
-
26
-
27
-
28
-
29
-
30
-
31
-
32
-
33
-
34
-
35
-
36
-
37
-
38
-
39
-
40
-
41
-
42
-
43
-
44
-
45
-
46
-
47
-
48
-
49
-
50
-
51
-
52
-
53
-
54
-
55
-
56
-
57
-
58
-
59
-
60
-
61
-
62
-
 63
63 -
 64
64 -
 65
65 -
 66
66 -
 67
67 -
 68
68 -
 69
69 -
 70
70 -
 71
71 -
 72
72 -
 73
73 -
 74
74 -
 75
75 -
 76
76 -
 77
77 -
 78
78 -
 79
79 -
 80
80 -
 81
81 -
 82
82 -
 83
83 -
84
-
85
-
86
-
87
-
88
-
89
-
90
-
91
-
92
-
93
-
94
-
95
-
96
-
97
-
98
-
99
-
100
-
101
-
102
-
103
-
104
-
105
-
106
-
107
-
108
-
109
-
110
-
111
-
112
-
113
-
114
 |
 |

ENTERGY CORPORATION AND SUBSIDIARIES 2
2000066
ENTERGY CORPORATION AND SUBSIDIARIES 2
2000066
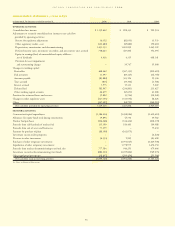
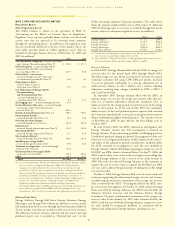
Net property, plant, and equipment for Entergy (including property under capital lease and associated accumulated amortization) by business
segment and functional category, as of December 31, 2006 and 2005, is shown below (in millions):
Depreciation rates on average depreciable property for Entergy approximated 2.7% in 2006, 2.7% in 2005, and 2.8% in 2004. Included in
these rates are the depreciation rates on average depreciable utility property of 2.6% in 2006, 2.6% in 2005, and 2.7% in 2004 and the
depreciation rates on average depreciable non-utility property of 3.6% in 2006, 3.2% in 2005, and 3.8% in 2004.
“Non-utility property - at cost (less accumulated depreciation)” for Entergy is reported net of accumulated depreciation of $167.5 million and
$162.2 million as of December 31, 2006 and 2005, respectively.
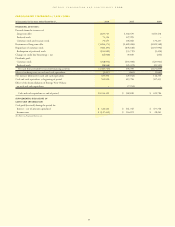
JOINTLY-OWNED GENERATING STATIONS
Certain Entergy subsidiaries jointly own electric generating facilities with third parties. The investments and expenses associated with these gen-
erating stations are recorded by the Entergy subsidiaries to the extent of their respective undivided ownership interests. As of December 31, 2006,
the subsidiaries’ investment and accumulated depreciation in each of these generating stations were as follows ($ in millions):
Total
Megawatt Accumulated
Generating Stations Fuel-Type Capability(1) Ownership Investment Depreciation
Utility:
Entergy Arkansas:
Independence Unit 1 Coal 815 31.50% $ 119 $ 82
Common Facilities Coal 15.75% $ 31 $ 20
White Bluff Units 1 and 2 Coal 1,635 57.00% $ 440 $ 293
Entergy Gulf States:
Roy S. Nelson Unit 6 Coal 550 70.00% $ 405 $ 258
Big Cajun 2 Unit 3 Coal 575 42.00% $ 233 $ 140
Entergy Mississippi:
Independence Units 1 and 2 and Common Facilities Coal 1,630 25.00% $ 235 $ 125
System Energy:
Grand Gulf Unit 1 Nuclear 1,270 90.00%(2) $3,824 $2,000
Non-Nuclear Wholesale Assets:
Harrison County Gas 550 60.90% $ 210 $ 15
Warren Gas 300 75.00% $ 21 $ 7
(1) “Total Megawatt Capability” is the dependable load carrying capability as demonstrated under actual operating conditions based on the primary fuel (assuming no curtailments)
that each station was designed to utilize.
(2) Includes an 11.5% leasehold interest held by System Energy. System Energy’s Grand Gulf lease obligations are discussed in Note 10 to the consolidated financial statements.
Non-
Utility
2006 Entergy Utility Nuclear All Other
Production:
Nuclear $ 7,558 $ 5,835 $ 1,723 $ –
Other 1,610 1,373 – 237
Transmission 2,500 2,500 – –
Distribution 5,041 5,041 – –
Other 1,113 1,111 – 2
Construction work
in progress 786 602 175 9
Nuclear fuel
(leased and owned) 830 476 354 –
Property, plant,
and equipment – net $19,438 $16,938 $2,252 $248
Non-
Utility
2005 Entergy Utility Nuclear All Other
Production:
Nuclear $ 7,390 $ 5,955 $ 1,435 $ –
Other 1,590 1,321 – 269
Transmission 2,394 2,394 – –
Distribution 4,599 4,599 – –
Other 992 989 – 3
Construction work
in progress 1,524 1,268 232 24
Nuclear fuel
(leased and owned) 708 373 335 –
Property, plant,
and equipment – net $19,197 $16,899 $2,002 $296
NOTESto CONSOLIDATED FINANCIAL STATEMENTS continued
57