Entergy 2006 Annual Report Download - page 67
Download and view the complete annual report
Please find page 67 of the 2006 Entergy annual report below. You can navigate through the pages in the report by either clicking on the pages listed below, or by using the keyword search tool below to find specific information within the annual report.-
 1
1 -
2
-
3
-
4
-
5
-
6
-
7
-
8
-
9
-
10
-
11
-
12
-
13
-
14
-
15
-
16
-
17
-
18
-
19
-
20
-
21
-
22
-
23
-
24
-
25
-
26
-
27
-
28
-
29
-
30
-
31
-
32
-
33
-
34
-
35
-
36
-
37
-
38
-
39
-
40
-
41
-
42
-
43
-
44
-
45
-
46
-
47
-
48
-
49
-
50
-
51
-
52
-
53
-
54
-
55
-
56
-
 57
57 -
 58
58 -
 59
59 -
 60
60 -
 61
61 -
 62
62 -
 63
63 -
 64
64 -
 65
65 -
 66
66 -
 67
67 -
 68
68 -
 69
69 -
 70
70 -
 71
71 -
 72
72 -
 73
73 -
 74
74 -
 75
75 -
 76
76 -
 77
77 -
78
-
79
-
80
-
81
-
82
-
83
-
84
-
85
-
86
-
87
-
88
-
89
-
90
-
91
-
92
-
93
-
94
-
95
-
96
-
97
-
98
-
99
-
100
-
101
-
102
-
103
-
104
-
105
-
106
-
107
-
108
-
109
-
110
-
111
-
112
-
113
-
114
 |
 |

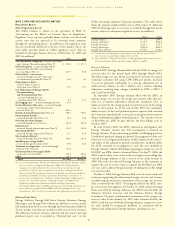
ENTERGY CORPORATION AND SUBSIDIARIES 2
2000066
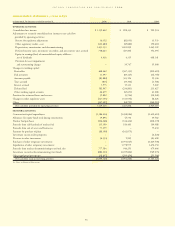
In thousands, for the years ended December 31, 2006 2005 2004
RETAINED EARNINGS
Retained Earnings – Beginning of period $5,433,931 $4,989,826 $4,502,508
Add:
Consolidated net income 1,132,602 $1,132,602 898,331 $898,331 909,524 $ 909,524
Adjustment for change in accounting method – – 5,524
Total 1,132,602 898,331 915,048
Deduct:
Dividends declared on common stock 448,572 453,657 427,740
Capital stock and other expenses 4,919 569 (10)
Total 453,491 454,226 427,730
Retained Earnings – End of period $6,113,042 $5,433,931 $4,989,826
ACCUMULATED OTHER COMPREHENSIVE
INCOME (LOSS) (NET OF TAXES)
Balance at beginning of period:
Accumulated derivative instrument
fair value changes $ (392,614) $ (141,411) $ (25,811)
Other accumulated comprehensive income (loss) items 48,795 47,958 18,016
Total (343,819) (93,453) (7,795)
Net derivative instrument fair value changes arising
during the period (net of tax (benefit) of $187,462, $(159,236),
and $(74,082)) 287,036 287,036 (251,203) (251,203) (115,600) (115,600)
Foreign currency translation (net of tax expense of
$1,122, $211, and $659) 3,207 3,207 602 602 1,882 1,882
Minimum pension liability (net of tax expense (benefit) of
$(5,911), $(9,176), and $1,875) (7,759) (7,759) (15,773) (15,773) 2,762 2,762
Pension and other postretirement liabilities (net of tax expense
(benefit) of ($92,419)) (75,805) – –
Net unrealized investment gains (net of tax expense of
$28,428, $10,573, and $16,599) 36,628 36,628 16,008 16,008 25,298 25,298
Balance at end of period:
Accumulated derivative instrument fair value changes (105,578) (392,614) (141,411)
Other accumulated comprehensive income items 5,066 48,795 47,958
Total $ (100,512) $ (343,819) $ (93,453)
Comprehensive Income $1,451,714 $ 647,965 $ 823,866
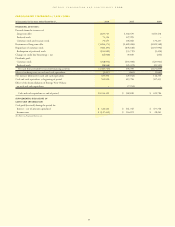
PAID-IN CAPITAL
Paid-in Capital – Beginning of period $4,817,637 $4,835,375 $4,767,615
Add (Deduct):
Issuance of equity units – (39,904) –
Common stock issuances related to stock plans 9,628 22,166 67,760
Paid-in Capital – End of period $4,827,265 $4,817,637 $4,835,375
See Notes to Financial Statements.
CONSOLIDATED STATEMENTS of RETAINED EARNINGS, COMPREHENSIVE INCOME and PAID-IN CAPITAL
51