Entergy 2006 Annual Report Download - page 68
Download and view the complete annual report
Please find page 68 of the 2006 Entergy annual report below. You can navigate through the pages in the report by either clicking on the pages listed below, or by using the keyword search tool below to find specific information within the annual report.-
 1
1 -
2
-
3
-
4
-
5
-
6
-
7
-
8
-
9
-
10
-
11
-
12
-
13
-
14
-
15
-
16
-
17
-
18
-
19
-
20
-
21
-
22
-
23
-
24
-
25
-
26
-
27
-
28
-
29
-
30
-
31
-
32
-
33
-
34
-
35
-
36
-
37
-
38
-
39
-
40
-
41
-
42
-
43
-
44
-
45
-
46
-
47
-
48
-
49
-
50
-
51
-
52
-
53
-
54
-
55
-
56
-
57
-
 58
58 -
 59
59 -
 60
60 -
 61
61 -
 62
62 -
 63
63 -
 64
64 -
 65
65 -
 66
66 -
 67
67 -
 68
68 -
 69
69 -
 70
70 -
 71
71 -
 72
72 -
 73
73 -
 74
74 -
 75
75 -
 76
76 -
 77
77 -
 78
78 -
79
-
80
-
81
-
82
-
83
-
84
-
85
-
86
-
87
-
88
-
89
-
90
-
91
-
92
-
93
-
94
-
95
-
96
-
97
-
98
-
99
-
100
-
101
-
102
-
103
-
104
-
105
-
106
-
107
-
108
-
109
-
110
-
111
-
112
-
113
-
114
 |
 |

ENTERGY CORPORATION AND SUBSIDIARIES 2
2000066
52
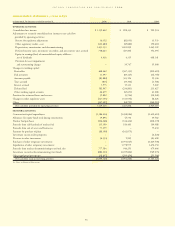
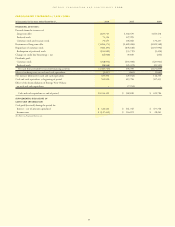
In thousands, as of December 31, 2006 2005
ASSETS
CURRENT ASSETS:
Cash and cash equivalents:
Cash $ 117,379 $ 221,773
Temporary cash investments – at cost, which approximates market 898,773 361,047
Total cash and cash equivalents 1,016,152 582,820
Note receivable – Entergy New Orleans DIP loan 51,934 90,000
Notes receivable 699 3,227
Accounts receivable:
Customer 410,512 629,717
Allowance for doubtful accounts (19,348) (30,805)
Other 487,264 459,152
Accrued unbilled revenues 249,165 477,570
Total receivables 1,127,593 1,535,634
Deferred fuel costs – 543,927
Accumulated deferred income taxes 11,680 –
Fuel inventory – at average cost 193,098 206,195
Materials and supplies – at average cost 604,998 610,932
Deferred nuclear refueling outage costs 147,521 164,152
Prepayments and other 171,759 325,795
Total 3,325,434 4,062,682
OTHER PROPERTY AND INVESTMENTS:
Investment in affiliates – at equity 229,089 296,784
Decommissioning trust funds 2,858,523 2,606,765
Non-utility property – at cost (less accumulated depreciation) 212,726 228,833
Other 47,115 81,535
Total 3,347,453 3,213,917
PROPERTY, PLANT AND EQUIPMENT:
Electric 30,713,284 29,161,027
Property under capital lease 730,182 727,565
Natural gas 92,787 86,794
Construction work in progress 786,147 1,524,085
Nuclear fuel under capital lease 269,485 271,615
Nuclear fuel 561,291 436,646
Total property, plant and equipment 33,153,176 32,207,732
Less – accumulated depreciation and amortization 13,715,099 13,010,687
Property, plant and equipment – net 19,438,077 19,197,045
DEFERRED DEBITS AND OTHER ASSETS:
Regulatory assets:
SFAS 109 regulatory asset – net 740,110 735,221
Other regulatory assets 2,768,352 2,133,724
Deferred fuel costs 168,122 120,489
Long-term receivables 19,349 25,572
Goodwill 377,172 377,172
Other 898,662 991,835
Total 4,971,767 4,384,013
TOTAL ASSETS $31,082,731 $30,857,657
See Notes to Financial Statements.
CONSOLIDATED BALANCE SHEETS