Entergy 2006 Annual Report Download - page 66
Download and view the complete annual report
Please find page 66 of the 2006 Entergy annual report below. You can navigate through the pages in the report by either clicking on the pages listed below, or by using the keyword search tool below to find specific information within the annual report.-
 1
1 -
2
-
3
-
4
-
5
-
6
-
7
-
8
-
9
-
10
-
11
-
12
-
13
-
14
-
15
-
16
-
17
-
18
-
19
-
20
-
21
-
22
-
23
-
24
-
25
-
26
-
27
-
28
-
29
-
30
-
31
-
32
-
33
-
34
-
35
-
36
-
37
-
38
-
39
-
40
-
41
-
42
-
43
-
44
-
45
-
46
-
47
-
48
-
49
-
50
-
51
-
52
-
53
-
54
-
55
-
 56
56 -
 57
57 -
 58
58 -
 59
59 -
 60
60 -
 61
61 -
 62
62 -
 63
63 -
 64
64 -
 65
65 -
 66
66 -
 67
67 -
 68
68 -
 69
69 -
 70
70 -
 71
71 -
 72
72 -
 73
73 -
 74
74 -
 75
75 -
 76
76 -
77
-
78
-
79
-
80
-
81
-
82
-
83
-
84
-
85
-
86
-
87
-
88
-
89
-
90
-
91
-
92
-
93
-
94
-
95
-
96
-
97
-
98
-
99
-
100
-
101
-
102
-
103
-
104
-
105
-
106
-
107
-
108
-
109
-
110
-
111
-
112
-
113
-
114
 |
 |

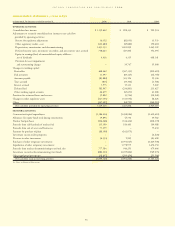
CONSOLIDATED STATEMENTS of INCOME
50
In thousands, except share data, for the years ended December 31, 2006 2005 2004
OPERATING REVENUES:
Domestic electric $ 9,063,135 $8,446,830 $7,932,577
Natural gas 84,230 77,660 208,499
Competitive businesses 1,784,793 1,581,757 1,544,445
Total 10,932,158 10,106,247 9,685,521
OPERATING EXPENSES:
Operating and Maintenance:
Fuel, fuel-related expenses, and gas purchased for resale 3,144,073 2,176,015 2,488,208
Purchased power 2,138,237 2,521,247 1,701,610
Nuclear refueling outage expenses 169,567 162,653 166,072
Provision for asset impairments and restructuring charges – – 55,000
Other operation and maintenance 2,335,364 2,122,206 2,268,332
Decommissioning 145,884 143,121 149,529
Taxes other than income taxes 428,561 382,521 403,635
Depreciation and amortization 887,792 856,377 893,574
Other regulatory credits – net (122,680) (49,882) (90,611)
Total 9,126,798 8,314,258 8,035,349
OPERATING INCOME 1,805,360 1,791,989 1,650,172
OTHER INCOME:
Allowance for equity funds used during construction 39,894 45,736 39,582
Interest and dividend income 198,835 150,479 109,635
Equity in earnings (loss) of unconsolidated equity affiliates 93,744 985 (78,727)
Miscellaneous – net 16,114 14,251 55,509
Total 348,587 211,451 125,999
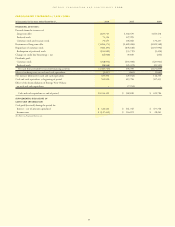
INTEREST AND OTHER CHARGES:
Interest on long-term debt 498,451 440,334 463,384
Other interest – net 75,502 64,646 40,133
Allowance for borrowed funds used during construction (23,931) (29,376) (25,741)
Preferred dividend requirements and other 27,783 25,427 23,525
Total 577,805 501,031 501,301
INCOME FROM CONTINUING OPERATIONS BEFORE INCOME TAXES
AND CUMULATIVE EFFECT OF ACCOUNTING CHANGES 1,576,142 1,502,409 1,274,870
Income taxes 443,044 559,284 365,305
INCOME FROM CONTINUING OPERATIONS
BEFORE CUMULATIVE EFFECT OF ACCOUNTING CHANGES 1,133,098 943,125 909,565
LOSS FROM DISCONTINUED OPERATIONS (net of income
tax expense (benefit) of $67, $(24,051), and $603, respectively) (496) (44,794) (41)
CONSOLIDATED NET INCOME $1,132,602 $ 898,331 $ 909,524
Basic earnings (loss) per average common share:
Continuing operations $5.46 $ 4.49 $4.01
Discontinued operations – $(0.21) –
Basic earnings per average common share $5.46 $ 4.27 $4.01
Diluted earnings (loss) per average common share:
Continuing operations $5.36 $ 4.40 $3.93
Discontinued operations – $(0.21) –
Diluted earnings per average common share $5.36 $ 4.19 $3.93
Dividends declared per common share $2.16 $ 2.16 $1.89
Basic average number of common shares outstanding 207,456,838 210,141,887 226,863,758
Diluted average number of common shares outstanding 211,452,455 214,441,362 231,193,686
See Notes to Financial Statements.
ENTERGY CORPORATION AND SUBSIDIARIES 2
2000066