Entergy 2006 Annual Report Download - page 102
Download and view the complete annual report
Please find page 102 of the 2006 Entergy annual report below. You can navigate through the pages in the report by either clicking on the pages listed below, or by using the keyword search tool below to find specific information within the annual report.-
 1
1 -
2
-
3
-
4
-
5
-
6
-
7
-
8
-
9
-
10
-
11
-
12
-
13
-
14
-
15
-
16
-
17
-
18
-
19
-
20
-
21
-
22
-
23
-
24
-
25
-
26
-
27
-
28
-
29
-
30
-
31
-
32
-
33
-
34
-
35
-
36
-
37
-
38
-
39
-
40
-
41
-
42
-
43
-
44
-
45
-
46
-
47
-
48
-
49
-
50
-
51
-
52
-
53
-
54
-
55
-
56
-
57
-
58
-
59
-
60
-
61
-
62
-
63
-
64
-
65
-
66
-
67
-
68
-
69
-
70
-
71
-
72
-
73
-
74
-
75
-
76
-
77
-
78
-
79
-
80
-
81
-
82
-
83
-
84
-
85
-
86
-
87
-
88
-
89
-
90
-
91
-
 92
92 -
 93
93 -
 94
94 -
 95
95 -
 96
96 -
 97
97 -
 98
98 -
 99
99 -
 100
100 -
 101
101 -
 102
102 -
 103
103 -
 104
104 -
 105
105 -
 106
106 -
 107
107 -
 108
108 -
 109
109 -
 110
110 -
 111
111 -
 112
112 -
113
-
114
 |
 |

ENTERGY CORPORATION AND SUBSIDIARIES 2
2000066
86
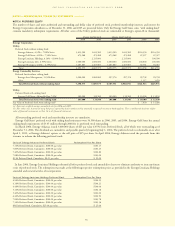
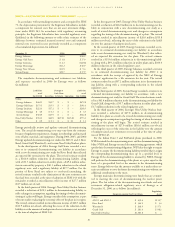
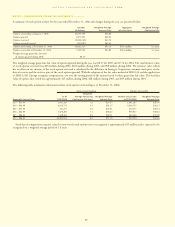
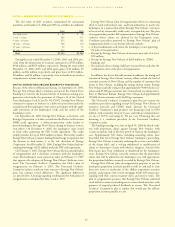
ESTIMATED FUTURE BENEFIT PAYMENTS
Based upon the assumptions used to measure Entergy’s qualified pension
and postretirement benefit obligation at December 31, 2006, and includ-
ing pension and postretirement benefits attributable to estimated future
employee service, Entergy expects that benefits to be paid and the
Medicare Part D subsidies to be received over the next ten years for
Entergy Corporation and its subsidiaries will be as follows (in thousands):
Estimated Future Benefits Payments
Qualified Non-Qualified
Postretirement Estimated Future
(before Medicare
Pension Pension Medicare Subsidy) Subsidy Receipts
2007 $129,140 $14,729 $ 62,662 $ 4,854
2008 $132,143 $ 5,646 $ 66,316 $ 5,531
2009 $136,824 $ 5,518 $ 69,507 $ 6,147
2010 $142,122 $ 5,455 $ 73,310 $ 6,740
2011 $148,366 $ 4,018 $ 76,563 $ 7,396
2012 –
2016 $888,406 $19,884 $430,687 $48,406
CONTRIBUTIONS
Entergy Corporation and its subsidiaries expect to contribute
$175.9 million (excluding about $1 million in employee contributions)
to the qualified pension plans and $66.4 million to its other postre-
tirement plans in 2007.
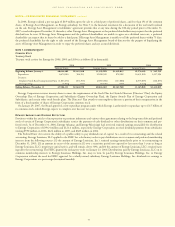
ADDITIONAL INFORMATION
The change in the qualified pension plans’ minimum pension
liability included in other comprehensive income and regulatory assets was
as follows for Entergy Corporation and its subsidiaries for 2006 and 2005.
2006 2005
Increase/(decrease) in the minimum
pension liability included in:
Other comprehensive income (before taxes) $ 14,030 $ 13,462
Regulatory assets $(134,667) $150,729
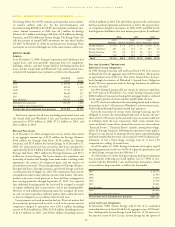
ACTUARIAL ASSUMPTIONS
The assumed health care cost trend rate used in measuring the APBO
of Entergy was 10% for 2007, gradually decreasing each successive
year until it reaches 4.5% in 2012 and beyond. The assumed health
care cost trend rate used in measuring the Net Other Postretirement
Benefit Cost of Entergy was 12% for 2006, gradually decreasing each
successive year until it reaches 4.5% in 2012 and beyond. A one per-
centage point change in the assumed health care cost trend rate for
2006 would have the following effects (in thousands):
1Percentage Point Increase 1Percentage Point Decrease
Impact Impact
on the sum of on the sum of
Impact on service costs and Impact on service costs and
the APBO interest cost the APBO interest cost
Entergy
Corporation
and Subsidiaries $103,072 $13,898 $(91,887) $(11,828)
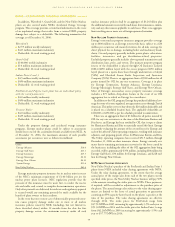
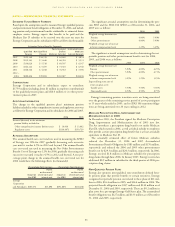
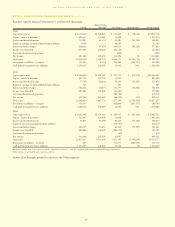
The significant actuarial assumptions used in determining the pen-
sion PBO and the SFAS 106 APBO as of December 31, 2006, and
2005 were as follows:
2006 2005
Weighted-average discount rate:
Pension 6.00% 5.90%
Other postretirement 6.00% 5.90%
Weighted-average rate of increase
in future compensation levels 3.25% 3.25%
The significant actuarial assumptions used in determining the net
periodic pension and other postretirement benefit costs for 2006,
2005, and 2004 were as follows:
2006 2005 2004
Weighted-average discount rate:
Pension 5.90% 6.00% 6.25%
Other postretirement 5.90% 6.00% 6.71%
Weighted-average rate of increase
in future compensation levels 3.25% 3.25% 3.25%
Expected long-term rate of
return on plan assets:
Taxable assets 5.50% 5.50% 5.50%
Non-taxable assets 8.50% 8.50% 8.75%
Entergy’s remaining pension transition assets are being amortized
over the greater of the remaining service period of active participants
or 15 years which ended in 2005, and its SFAS 106 transition obliga-
tions are being amortized over 20 years ending in 2012.
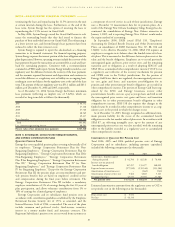
MEDICARE PRESCRIPTION DRUG,IMPROVEMENT AND
MODERNIZATION ACT OF 2003
In December 2003, the President signed the Medicare Prescription
Drug, Improvement and Modernization Act of 2003 into law.
The Act introduces a prescription drug benefit cost under Medicare
(Part D), which started in 2006, as well as federal subsidy to employers
who provide a retiree prescription drug benefit that is at least actuarially
equivalent to Medicare Part D.
The actuarially estimated effect of future Medicare subsidies
reduced the December 31, 2006 and 2005 Accumulated
Postretirement Benefit Obligation by $183 million and $176 million,
respectively, and reduced the 2006 and 2005 other postretirement
benefit cost by $29.3 million and $24.3 million, respectively. In 2006,
Entergy received $1.8 million in Medicare subsidies for prescription
drug claims through June 2006. In January 2007, Entergy received an
additional $0.9 million in subsidies for the third quarter of 2006 pre-
scription drug claims.
NON-QUALIFIED PENSION PLANS
Entergy also sponsors non-qualified, non-contributory defined bene-
fit pension plans that provide benefits to certain executives. Entergy
recognized net periodic pension cost related to these plans of $21 mil-
lion in 2006, $16.4 million in 2005, and $16.4 million in 2004. The
projected benefit obligation was $137 million and $142 million as of
December 31, 2006 and 2005, respectively. There are $0.2 million in
plan assets for a pre-merger Entergy Gulf States plan. The accumulated
benefit obligation was $127 million and $133 million as of December
31, 2006 and 2005, respectively.
NOTESto CONSOLIDATED FINANCIAL STATEMENTS continued