Entergy 2006 Annual Report Download - page 106
Download and view the complete annual report
Please find page 106 of the 2006 Entergy annual report below. You can navigate through the pages in the report by either clicking on the pages listed below, or by using the keyword search tool below to find specific information within the annual report.-
 1
1 -
2
-
3
-
4
-
5
-
6
-
7
-
8
-
9
-
10
-
11
-
12
-
13
-
14
-
15
-
16
-
17
-
18
-
19
-
20
-
21
-
22
-
23
-
24
-
25
-
26
-
27
-
28
-
29
-
30
-
31
-
32
-
33
-
34
-
35
-
36
-
37
-
38
-
39
-
40
-
41
-
42
-
43
-
44
-
45
-
46
-
47
-
48
-
49
-
50
-
51
-
52
-
53
-
54
-
55
-
56
-
57
-
58
-
59
-
60
-
61
-
62
-
63
-
64
-
65
-
66
-
67
-
68
-
69
-
70
-
71
-
72
-
73
-
74
-
75
-
76
-
77
-
78
-
79
-
80
-
81
-
82
-
83
-
84
-
85
-
86
-
87
-
88
-
89
-
90
-
91
-
92
-
93
-
94
-
95
-
 96
96 -
 97
97 -
 98
98 -
 99
99 -
 100
100 -
 101
101 -
 102
102 -
 103
103 -
 104
104 -
 105
105 -
 106
106 -
 107
107 -
 108
108 -
 109
109 -
 110
110 -
 111
111 -
 112
112 -
 113
113 -
 114
114
 |
 |

ENTERGY CORPORATION AND SUBSIDIARIES 2
2000066
90
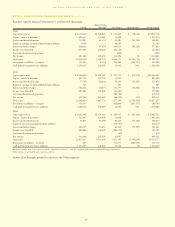
Entergy’s segment financial information is as follows (in thousands):
Non-Utility
Utility Nuclear*All Other*Eliminations Consolidated
2006
Operating revenues $ 9,150,030 $1,544,873 $ 275,299 $ (38,044) $10,932,158
Deprec., amort. & decomm. 886,537 134,661 12,478 – 1,033,676
Interest and dividend income 112,887 83,155 95,985 (93,192) 198,835
Equity in earnings of unconsolidated equity affiliates 4,058 – 89,686 – 93,744
Interest and other charges 428,662 47,424 194,911 (93,192) 577,805
Income taxes (benefits) 333,105 204,659 (94,720) – 443,044
Loss from discontinued operations – – (496) – (496)
Net Income 691,160 309,496 131,894 52 1,132,602
Total assets 25,238,359 5,369,730 2,866,377 (2,391,735) 31,082,731
Investments in affiliates – at equity 154,193 (5,233) 214,266 (134,137) 229,089
Cash paid for long-lived asset additions 1,259,135 302,865 23,034 982 1,586,016
2005
Operating revenues $ 8,526,943 $1,421,547 $ 237,735 $ (79,978) $10,106,247
Deprec., amort. & decomm. 867,755 117,752 13,991 – 999,498
Interest and dividend income 75,748 66,836 78,185 (70,290) 150,479
Equity in earnings of unconsolidated equity affiliates 765 – 220 – 985
Interest and other charges 386,672 50,874 133,777 (70,292) 501,031
Income taxes (benefits) 405,662 163,865 (10,243) – 559,284
Loss from discontinued operations – – (44,794) – (44,794)
Net income 659,760 282,623 (44,019) (33) 898,331
Total assets 25,248,820 4,887,572 3,477,169 (2,755,904) 30,857,657
Investments in affiliates – at equity 150,135 – 428,006 (281,357) 296,784
Cash paid for long-lived asset additions 1,285,012 160,899 11,230 945 1,458,086
2004
Operating revenues $ 8,142,808 $1,341,852 $ 265,051 $ (64,190) $ 9,685,521
Deprec., amort. & decomm. 915,667 106,408 21,028 – 1,043,103
Interest and dividend income 40,831 63,569 60,430 (55,195) 109,635
Equity in loss of unconsolidated equity affiliates – – (78,727) – (78,727)
Interest and other charges 406,315 53,657 96,526 (55,197) 501,301
Income taxes (benefits) 406,864 142,620 (184,179) – 365,305
Loss from discontinued operations – – (41) – (41)
Net income 643,408 245,029 21,087 – 909,524
Total assets 22,937,237 4,531,604 2,423,194 (1,581,258) 28,310,777
Investments in affiliates – at equity 207 – 512,571 (280,999) 231,779
Cash paid for long-lived asset additions 1,152,167 242,822 15,626 (5) 1,410,610
Businesses marked with * are referred to as the “competitive businesses,” with the exception of the parent company, Entergy Corporation.
Eliminations are primarily intersegment activity.
Almost all of Entergy’s goodwill is related to the Utility segment.
NOTESto CONSOLIDATED FINANCIAL STATEMENTS continued