Entergy 2006 Annual Report Download - page 109
Download and view the complete annual report
Please find page 109 of the 2006 Entergy annual report below. You can navigate through the pages in the report by either clicking on the pages listed below, or by using the keyword search tool below to find specific information within the annual report.-
 1
1 -
2
-
3
-
4
-
5
-
6
-
7
-
8
-
9
-
10
-
11
-
12
-
13
-
14
-
15
-
16
-
17
-
18
-
19
-
20
-
21
-
22
-
23
-
24
-
25
-
26
-
27
-
28
-
29
-
30
-
31
-
32
-
33
-
34
-
35
-
36
-
37
-
38
-
39
-
40
-
41
-
42
-
43
-
44
-
45
-
46
-
47
-
48
-
49
-
50
-
51
-
52
-
53
-
54
-
55
-
56
-
57
-
58
-
59
-
60
-
61
-
62
-
63
-
64
-
65
-
66
-
67
-
68
-
69
-
70
-
71
-
72
-
73
-
74
-
75
-
76
-
77
-
78
-
79
-
80
-
81
-
82
-
83
-
84
-
85
-
86
-
87
-
88
-
89
-
90
-
91
-
92
-
93
-
94
-
95
-
96
-
97
-
98
-
 99
99 -
 100
100 -
 101
101 -
 102
102 -
 103
103 -
 104
104 -
 105
105 -
 106
106 -
 107
107 -
 108
108 -
 109
109 -
 110
110 -
 111
111 -
 112
112 -
 113
113 -
 114
114
 |
 |

ENTERGY CORPORATION AND SUBSIDIARIES 2
2000066
with offsetting regulatory assets or liabilities. The notional volumes of
these swaps are based on a portion of projected purchases of gas for
the summer (electric generation) and winter (gas distribution at
Entergy Gulf States and Entergy New Orleans) peak seasons.
Entergy’s exposure to market risk is determined by a number of fac-
tors, including the size, term, composition, and diversification of
positions held, as well as market volatility and liquidity. For instru-
ments such as options, the time period during which the option may
be exercised and the relationship between the current market price of
the underlying instrument and the option’s contractual strike or exer-
cise price also affects the level of market risk. A significant factor
influencing the overall level of market risk to which Entergy is
exposed is its use of hedging techniques to mitigate such risk. Entergy
manages market risk by actively monitoring compliance with stated
risk management policies as well as monitoring the effectiveness of its
hedging policies and strategies. Entergy’s risk management policies limit
the amount of total net exposure and rolling net exposure during the
stated periods. These policies, including related risk limits, are regularly
assessed to ensure their appropriateness given Entergy’s objectives.
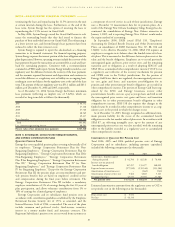
Hedging Derivatives
Entergy classifies substantially all of the following types of derivative
instruments held by its consolidated businesses as cash flow hedges:
Instrument Business
Natural gas and electricity Non-Utility Nuclear,
futures and forwards Energy Commodity Services,
Non-Nuclear Wholesale Assets
Foreign currency forwards Utility, Non-Utility Nuclear
Cash flow hedges with net unrealized losses of approximately
$99 million (net-of-tax) at December 31, 2006 are scheduled to mature
during 2007. Net losses totaling approximately $79 million were realized
during 2006 on the maturity of cash flow hedges. Unrealized gains or
losses result from hedging power output at the Non-Utility Nuclear
power stations and foreign currency hedges related to Euro-denominated
nuclear fuel acquisitions. The related gains or losses from hedging power
are included in revenues when realized. The realized gains or
losses from foreign currency transactions are included in the cost of cap-
italized fuel. The maximum length of time over which Entergy is
currently hedging the variability in future cash flows for forecasted trans-
actions at December 31, 2006 is approximately five years. The ineffective
portion of the change in the value of Entergy’s cash flow hedges during
2006, 2005, and 2004 was insignificant.
Fair Values
Financial Instruments
The estimated fair value of Entergy’s financial instruments is deter-
mined using bid prices reported by dealer markets and by nationally
recognized investment banking firms. The estimated fair value of
derivative financial instruments is based on market quotes.
Considerable judgment is required in developing some of the esti-
mates of fair value. Therefore, estimates are not necessarily indicative
of the amounts that Entergy could realize in a current market
exchange. In addition, gains or losses realized on financial instruments
held by regulated businesses may be reflected in future rates and
therefore do not necessarily accrue to the benefit or detriment
of stockholders.
Entergy considers the carrying amounts of most of its financial instru-
ments classified as current assets and liabilities to be a reasonable estimate
of their fair value because of the short maturity of these instruments.
Additional information regarding financial instruments and their fair
values is included in Notes 5 and 6 to the financial statements.
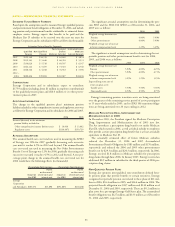
NOTE 17. DECOMMISSIONING TRUST FUNDS
Entergy holds debt and equity securities, classified as available-
for-sale, in nuclear decommissioning trust accounts. The NRC requires
Entergy to maintain trusts to fund the costs of decommissioning ANO
1, ANO 2, River Bend, Waterford 3, Grand Gulf, Pilgrim, Indian Point
1 and 2, and Vermont Yankee (NYPA currently retains the decommis-
sioning trusts and liabilities for Indian Point 3 and FitzPatrick). The
funds are invested primarily in equity securities; fixed-rate, fixed-income
securities; and cash and cash equivalents. The majority of the unrealized
gains and losses below relate to Entergy’s Utility operating companies
and System Energy. The securities held at December 31, 2006 and 2005
are summarized as follows (in millions):
Total Total
Unrealized Unrealized
2006 Fair Value Gains Losses
Equity $1,706 $418 $ 2
Debt Securities 1,153 17 11
Total $ 2,859 $435 $13
2005
Equity $1,502 $280 $12
Debt Securities 1,105 20 10
Total $ 2,607 $300 $22
The debt securities have an average coupon rate of approximately
5.2%, an average duration of approximately 5.5 years, and an average
maturity of approximately 8.9 years. The equity securities are gener-
ally held in funds that are designed to approximate or somewhat
exceed the return of the Standard & Poor’s 500 Index, and a relatively
small percentage of the securities are held in a fund intended to
replicate the return of the Wilshire 4500 Index.
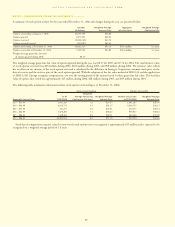
The fair value and gross unrealized losses of available-for-sale equity
and debt securities, summarized by investment type and length of
time that the securities have been in a continuous loss position, are
as follows at December 31, 2006 (in millions):
Equity Securities Debt Securities
Gross Gross
Unrealized Unrealized
Fair Value Losses Fair Value Losses
Less than 12 months $ 6 $ – $270 $ 2
More than 12 months 33 2 335 9
Total $39 $ 2 $605 $11
Entergy evaluates these unrealized gains and losses at the end of
each period to determine whether an other than temporary impair-
ment has occurred. The assessment of whether an investment has
suffered an other than temporary impairment is based on a number of
factors including, first, whether Entergy has the ability and intent to
hold the investment to recover its value and, then, whether it is
expected that the investment will recover its value within a reasonable
period of time. Entergy's trusts are managed by third parties who have
independent discretion over purchases and sales of securities in the
trusts and, according to interpretations of authoritative literature in
December 2006, Entergy did not satisfy the ability to hold criteria.
Entergy did not record any impairments in 2006 or 2005 on these
assets due to the insignificance of any impairments.
Due to the regulatory treatment of decommissioning collections and
trust fund earnings, Entergy Arkansas, Entergy Gulf States, Entergy
Louisiana, and System Energy record regulatory assets or liabilities for
unrealized gains and losses on trust investments. For the unregulated
portion of River Bend, Entergy Gulf States has recorded an offsetting
amount of unrealized gains or losses in other deferred credits.
NOTESto CONSOLIDATED FINANCIAL STATEMENTS continued
93