Entergy 2006 Annual Report Download - page 47
Download and view the complete annual report
Please find page 47 of the 2006 Entergy annual report below. You can navigate through the pages in the report by either clicking on the pages listed below, or by using the keyword search tool below to find specific information within the annual report.-
 1
1 -
2
-
3
-
4
-
5
-
6
-
7
-
8
-
9
-
10
-
11
-
12
-
13
-
14
-
15
-
16
-
17
-
18
-
19
-
20
-
21
-
22
-
23
-
24
-
25
-
26
-
27
-
28
-
29
-
30
-
31
-
32
-
33
-
34
-
35
-
36
-
 37
37 -
 38
38 -
 39
39 -
 40
40 -
 41
41 -
 42
42 -
 43
43 -
 44
44 -
 45
45 -
 46
46 -
 47
47 -
 48
48 -
 49
49 -
 50
50 -
 51
51 -
 52
52 -
 53
53 -
 54
54 -
 55
55 -
 56
56 -
 57
57 -
58
-
59
-
60
-
61
-
62
-
63
-
64
-
65
-
66
-
67
-
68
-
69
-
70
-
71
-
72
-
73
-
74
-
75
-
76
-
77
-
78
-
79
-
80
-
81
-
82
-
83
-
84
-
85
-
86
-
87
-
88
-
89
-
90
-
91
-
92
-
93
-
94
-
95
-
96
-
97
-
98
-
99
-
100
-
101
-
102
-
103
-
104
-
105
-
106
-
107
-
108
-
109
-
110
-
111
-
112
-
113
-
114
 |
 |

ENTERGY CORPORATION AND SUBSIDIARIES 2
2000066
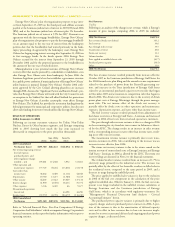
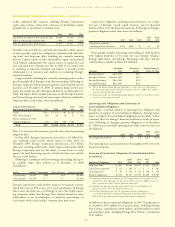
Non-Utility Nuclear
Net revenue increased for Non-Utility Nuclear primarily due to
higher pricing in its contracts to sell power. Also contributing to the
increase in revenues was increased generation in 2005 due to power
uprates at several plants completed in 2004 and 2005 and fewer
planned and unplanned outages in 2005. Following are key perform-
ance measures for Non-Utility Nuclear for 2005 and 2004:
2005 2004
Net MW in operation at December 31 4,105 4,058
Average realized price per MWh $42.39 $41.26
Generation in GWh for the year 33,539 32,524
Capacity factor for the year 93% 92%
Other Operation and Maintenance Expenses
Other operation and maintenance expenses increased slightly for the
Utility from $1.467 billion in 2004 to $1.471 billion in 2005. The
variance includes the following:
■an increase of $10 million in nuclear expenses for contract and
material costs associated with maintenance outages and nuclear
refueling outage pre-work;
■an increase of $10 million in miscellaneous regulatory reserves;
■an increase of $8 million in storm reserves (unrelated to
Hurricanes Katrina and Rita);
■an increase of $5 million in estimated loss provisions recorded for
the bankruptcy of CashPoint, which managed a network of
payment agents for the Utility operating companies;
■an increase of $5 million in payroll and benefits costs which
includes higher pension and post-retirement benefit costs
substantially offset by incentive compensation true-ups;
■a decrease of $18 million due to a shift in labor and material costs
from normal maintenance work to storm restoration work; and
■a decrease of $16 million related to proceeds received from the
radwaste settlement, which is discussed further in “Significant
Factors and Known Trends - Central States Compact Claim.”
Taxes Other Than Income Taxes
Taxes other than income taxes increased for the Utility from $300.7
million in 2004 to $321.9 million in 2005 primarily due to higher
employment taxes and higher assessed values for ad valorem tax
purposes in 2005.
Other Income
Other income decreased for the Utility from $134 million in 2004 to
$111.2 million in 2005 primarily due to:
■a revision in 2004 to the estimated decommissioning cost liability
for River Bend in accordance with a new decommissioning cost
study that reflected a life extension for the plant. For the portion
of River Bend not subject to cost-based ratemaking, the revised
estimate resulted in the elimination of the asset retirement cost
that had been recorded at the time of adoption of SFAS 143 with
the remainder recorded as miscellaneous income of $27.7 million;
■a decrease of $26.3 million in Entergy New Orleans earnings,
which is now reported as an unconsolidated equity affiliate for
2005 in the “Equity in earnings (loss) of unconsolidated equity
affiliates” line on the Income Statement. The decrease in Entergy
New Orleans’ earnings is primarily a result of the effects of
Hurricane Katrina, which caused lower net revenue, partially
offset by lower other operation and maintenance expenses and
lower interest charges; and
■a decrease of $10.1 million at Entergy Gulf States due to a
reduction in 2004 in the loss provision for an environmental
clean-up site.
The decrease for the Utility was partially offset by an increase of $35.3
million in interest and dividend income due to both the proceeds
from the radwaste settlement, which is discussed further in
“Significant Factors and Known Trends - Central States Compact
Claim,” and increased interest on temporary cash investments.
Other income decreased slightly for Non-Utility Nuclear from $78
million in 2004 to $72 million in 2005. 2005 includes $15.8 million
net-of-tax resulting from a reduction in the decommissioning liability
for a plant, and 2004 includes $11.9 million net-of-tax resulting from
a reduction in the decommissioning liability for a plant. Both of these
reductions are discussed in Note 9 to the financial statements.
Other income increased for Parent & Other primarily because of a
$46.4 million loss in 2004 from Entergy’s investment in Entergy-Koch,
primarily resulting from Entergy-Koch’s trading business reporting a
loss from its operations in 2004. Miscellaneous income from proceeds
of $18.9 million from the sale of SO2allowances by the non-nuclear
wholesale assets business also contributed to the increase.
Provision for Asset Impairments and
Discontinued Operations
Entergy recorded a $55 million ($36 million net-of-tax) charge in
2004 as a result of an impairment of the value of the Warren Power
plant, which is owned in the non-nuclear wholesale assets business.
Entergy concluded that the plant’s value was impaired based on valu-
ation studies prepared in connection with the Entergy Asset
Management stock sale discussed below.
Earnings for Parent & Other in 2005 were negatively affected by
$44.8 million (net-of-tax) of discontinued operations due to the planned
sale of the retail electric portion of Entergy’s Competitive Retail Services
business operating in the ERCOT region of Texas. This amount includes
a net charge of $25.8 million, net-of-tax, related to the impairment
reserve for the remaining net book value of the Competitive Retail
Services business’ information technology systems.
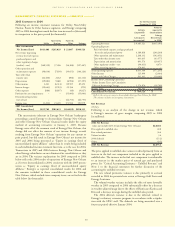
Income Taxes
The effective income tax rates for 2005 and 2004 were 37.3% and
28.7%, respectively. The lower effective income tax rate in 2004 is pri-
marily due to a tax benefit resulting from the sale in December 2004 of
preferred stock and less than 1% of the common stock of Entergy Asset
Management, an Entergy subsidiary. An Entergy subsidiary sold the
stock to a third party for $29.75 million. The sale resulted in a capital
loss for tax purposes of $370 million, producing a net tax benefit of
$97 million that Entergy recorded in the fourth quarter of 2004. See
Note 3 to the financial statements for a reconciliation of the federal
statutory rate of 35.0% to the effective income tax rates, and for
additional discussion regarding income taxes.
LIQUIDITY AND CAPITAL RESOURCES
This section discusses Entergy’s capital structure, capital spending
plans and other uses of capital, sources of capital, and the cash flow
activity presented in the cash flow statement.
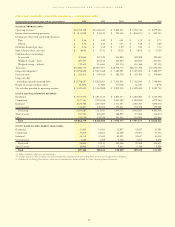
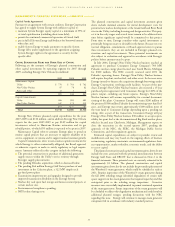
CAPITAL STRUCTURE
Entergy’s capitalization is balanced between equity and debt, as shown in
the following table. The decrease in the debt to capital percentage
from 2005 to 2006 is the result of an increase in shareholders’ equity,
primarily due to an increase in retained earnings, partially offset by
repurchases of common stock. The increase in the debt to capital per-
centage from 2004 to 2005 is the result of increased debt outstanding
due to additional borrowings on Entergy Corporation’s revolving credit
MANAGEMENT’S FINANCIAL DISCUSSION and ANALYSIS continued
31