Entergy 2006 Annual Report Download - page 101
Download and view the complete annual report
Please find page 101 of the 2006 Entergy annual report below. You can navigate through the pages in the report by either clicking on the pages listed below, or by using the keyword search tool below to find specific information within the annual report.-
 1
1 -
2
-
3
-
4
-
5
-
6
-
7
-
8
-
9
-
10
-
11
-
12
-
13
-
14
-
15
-
16
-
17
-
18
-
19
-
20
-
21
-
22
-
23
-
24
-
25
-
26
-
27
-
28
-
29
-
30
-
31
-
32
-
33
-
34
-
35
-
36
-
37
-
38
-
39
-
40
-
41
-
42
-
43
-
44
-
45
-
46
-
47
-
48
-
49
-
50
-
51
-
52
-
53
-
54
-
55
-
56
-
57
-
58
-
59
-
60
-
61
-
62
-
63
-
64
-
65
-
66
-
67
-
68
-
69
-
70
-
71
-
72
-
73
-
74
-
75
-
76
-
77
-
78
-
79
-
80
-
81
-
82
-
83
-
84
-
85
-
86
-
87
-
88
-
89
-
90
-
 91
91 -
 92
92 -
 93
93 -
 94
94 -
 95
95 -
 96
96 -
 97
97 -
 98
98 -
 99
99 -
 100
100 -
 101
101 -
 102
102 -
 103
103 -
 104
104 -
 105
105 -
 106
106 -
 107
107 -
 108
108 -
 109
109 -
 110
110 -
 111
111 -
112
-
113
-
114
 |
 |

ENTERGY CORPORATION AND SUBSIDIARIES 2
2000066
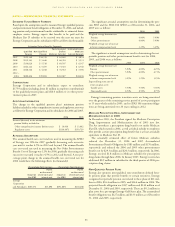
OTHER POSTRETIREMENT BENEFIT OBLIGATIONS,PLAN ASSETS,FUNDED
STATUS,AND AMOUNTS NOT YET RECOGNIZED AND RECOGNIZED IN THE
BALANCE SHEET OF ENTERGY CORPORATION AND ITS SUBSIDIARIES AS OF
DECEMBER 31, 2006 AND 2005 (IN THOUSANDS):
2006 2005
Change in APBO
Balance at beginning of year $ 997,969 $ 928,217
Service cost 41,480 37,310
Interest cost 57,263 51,883
Plan amendments (10,708) (64,200)
Plan participant contributions 6,904 6,749
Actuarial loss/(gain) (17,838) 98,041
Benefits paid (62,314) (60,031)
Medicare Part D subsidy received 1,610 –
Balance at end of year $1,014,366 $ 997,969
Change in Plan Assets
Fair value of assets at beginning of year $ 234,516 $ 214,005
Actual return on plan assets 27,912 15,003
Employer contributions 64,058 58,790
Plan participant contributions 6,904 6,749
Benefits paid (60,700) (60,031)
Fair value of assets at end of year $ 272,690 $ 234,516
Funded status $ (741,676) $(763,453)
Amounts not yet recognized in the balance sheet
(before application of SFAS 158)
Unrecognized transition obligation 13,007 15,176
Unrecognized prior service cost (62,062) (66,105)
Unrecognized net loss 353,733 403,252
Accrued other post retirement
benefit cost recognized $ (436,998) $(411,130)
Amounts recognized in the balance sheet (SFAS 158)
Current liabilities $ (27,372)
Non-current liabilities (714,304)
Total funded status $ (741,676)
Change in amount recognized
due to SFAS 158 $ (304,678)
Amounts recognized in regulatory assets (before tax)
Transition obligation $8,686
Prior service cost (9,263)
Net loss/(gain) 195,567
Total $ 194,990
Amounts recognized in OCI (before tax)
Transition obligation $4,321
Prior service cost (52,799)
Net loss/(gain) 158,166
Total $ 109,688
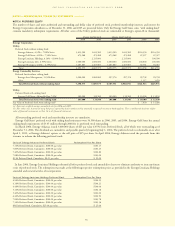
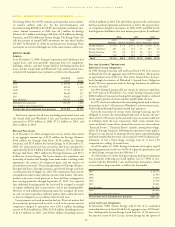
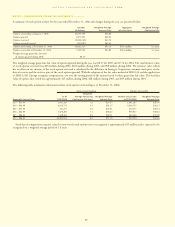
QUALIFIED PENSION AND OTHER POSTRETIREMENT PLANS’ASSETS
Entergy’s qualified pension and postretirement plans weighted-aver-
age asset allocations by asset category at December 31, 2006 and
2005 are as follows:
Qualified Pension Postretirement
2006 2005 2006 2005
Domestic Equity Securities 43% 45% 37% 37%
International Equity Securities 21% 21% 14% 15%
Fixed-Income Securities 34% 32% 49% 47%
Other 2% 2% –% 1%
The Plan Administrator’s trust asset investment strategy is to invest
the assets in a manner whereby long-term earnings on the assets (plus
cash contributions) provide adequate funding for retiree benefit
payments. The mix of assets is based on an optimization study that
identifies asset allocation targets in order to achieve the maximum
return for an acceptable level of risk, while minimizing the expected
contributions and pension and postretirement expense.
In the optimization study, the Plan Administrator formulates
assumptions about characteristics, such as expected asset class invest-
ment returns, volatility (risk), and correlation coefficients among the
various asset classes. The future market assumptions used in the opti-
mization study are determined by examining historical market
characteristics of the various asset classes, and making adjustments to
reflect future conditions expected to prevail over the study period.
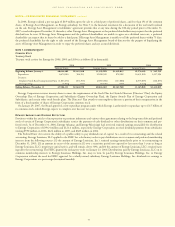
The optimization analysis utilized in the Plan Administrator’s latest
study produced the following approved asset class target allocations.
Pension Postretirement
Domestic Equity Securities 45% 37%
International Equity Securities 20% 14%
Fixed-Income Securities 31% 49%
Other (Cash and GACs) 4% 0%
These allocation percentages combined with each asset class’
expected investment return produced an aggregate return expectation
for the five years following the study of 7.6% for pension assets, 5.4%
for taxable postretirement assets, and 7.2% for non-taxable postretire-
ment assets.
The expected long term rate of return of 8.50% for the qualified
Retirement Plans assets is based on the expected return of each asset
class, weighted by the target allocation for each class. The expected
return for each asset class was developed using risk and return assump-
tions that use forward projections based on historical experience. This
analysis resulted in a weighted mean of 8.57% and a 50th percentile
return of 8.54% which supports the long term rate of return assump-
tion of 8.50%.
The expected long term rate of return of 8.50% for the non-taxable
VEBA trust assets is based on the expected return of each asset class,
weighted by the target allocation for each class. The expected return
for each asset class was developed using risk and return assumptions
that use forward projections based on historical experience. This
analysis resulted in a weighted mean of 8.24% and a 50th percentile
return of 8.22% which is consistent with the long term rate of return
assumption of 8.50%. For the taxable VEBA trust, the asset allocation
has a high percentage of non-taxable bonds. After reflecting the non-
taxable bond percentage and unrelated business income tax supports
an expected long term rate of return of 5.50%.
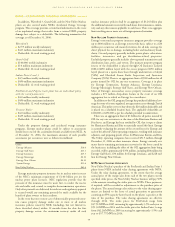
Since precise allocation targets are inefficient to manage security
investments, the following ranges were established to produce an
acceptable economically efficient plan to manage to targets:
Pension Postretirement
Domestic Equity Securities 45% to 55% 32% to 42%
International Equity Securities 15% to 25% 9% to 19%
Fixed-Income Securities 25% to 35% 44% to 54%
Other 0% to 10% 0% to 5%
ACCUMULATED PENSION BENEFIT OBLIGATION
The accumulated benefit obligation for Entergy’s qualified pension
plans was $2.7 billion and $2.5 billion at December 31, 2006 and
2005, respectively.
NOTESto CONSOLIDATED FINANCIAL STATEMENTS continued
85