Entergy 2006 Annual Report Download - page 104
Download and view the complete annual report
Please find page 104 of the 2006 Entergy annual report below. You can navigate through the pages in the report by either clicking on the pages listed below, or by using the keyword search tool below to find specific information within the annual report.-
 1
1 -
2
-
3
-
4
-
5
-
6
-
7
-
8
-
9
-
10
-
11
-
12
-
13
-
14
-
15
-
16
-
17
-
18
-
19
-
20
-
21
-
22
-
23
-
24
-
25
-
26
-
27
-
28
-
29
-
30
-
31
-
32
-
33
-
34
-
35
-
36
-
37
-
38
-
39
-
40
-
41
-
42
-
43
-
44
-
45
-
46
-
47
-
48
-
49
-
50
-
51
-
52
-
53
-
54
-
55
-
56
-
57
-
58
-
59
-
60
-
61
-
62
-
63
-
64
-
65
-
66
-
67
-
68
-
69
-
70
-
71
-
72
-
73
-
74
-
75
-
76
-
77
-
78
-
79
-
80
-
81
-
82
-
83
-
84
-
85
-
86
-
87
-
88
-
89
-
90
-
91
-
92
-
93
-
 94
94 -
 95
95 -
 96
96 -
 97
97 -
 98
98 -
 99
99 -
 100
100 -
 101
101 -
 102
102 -
 103
103 -
 104
104 -
 105
105 -
 106
106 -
 107
107 -
 108
108 -
 109
109 -
 110
110 -
 111
111 -
 112
112 -
 113
113 -
 114
114
 |
 |

ENTERGY CORPORATION AND SUBSIDIARIES 2
2000066
88
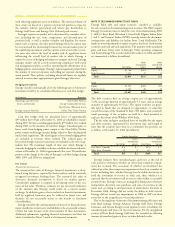
A summary of stock option activity for the year ended December 31, 2006 and changes during the year are presented below:
Number Weighted-Average Aggregate Weighted-Average
of Options Exercise Price Intrinsic Value Contractual Life
Options outstanding at January 1, 2006 10,855,459 $46.80
Options granted 1,875,293 $69.01
Options exercised (1,804,742) $42.54
Options forfeited/expired (123,087) $65.05
Options outstanding at December 31, 2006 10,802,923 $51.16 $445 million 6.2 years
Options exercisable at December 31, 2006 7,452,550 $43.83 $361 million 5.2 years
Weighted-average grant-date fair value
of options granted during 2006 $9.21
The weighted-average grant-date fair value of options granted during the year was $8.17 for 2005 and $7.76 for 2004. The total intrinsic value
of stock options exercised was $65 million during 2006, $100 million during 2005, and $98 million during 2004. The intrinsic value, which
has no effect on net income, of the stock options exercised is calculated by the difference in Entergy’s Corporation common stock price on the
date of exercise and the exercise price of the stock options granted. With the adoption of the fair value method of SFAS 123 and the application
of SFAS 123R, Entergy recognizes compensation cost over the vesting period of the options based on their grant-date fair value. The total fair
value of options that vested was approximately $15 million during 2006, $28 million during 2005, and $49 million during 2004.
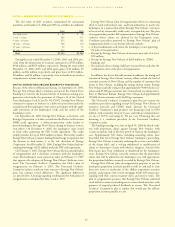
The following table summarizes information about stock options outstanding as of December 31, 2006:
Options Outstanding Options Exercisable
Weighted-
As of Average Remaining Weighted-Average Number Exercisable Weighted-Average
Range of Exercise Prices 12/31/2006 Contractual Life-Years Exercise Price at 12/31/2006 Exercise Price
$23 – $33.99 1,041,285 3.2 $25.55 1,041,285 $25.55
$34 – $44.99 4,634,715 5.1 $41.15 4,634,715 $41.15
$45 – $55.99 210,277 3.6 $49.41 210,277 $49.41
$56 – $66.99 1,478,283 7.1 $58.62 939,927 $58.63
$67 – $86.20 3,438,363 8.5 $69.31 626,346 $70.00
$23 – $86.20 10,802,923 6.2 $51.16 7,452,550 $43.83
Stock-based compensation expense related to non-vested stock options not yet recognized is approximately $13 million and is expected to be
recognized on a weighted-average period of 1.8 years.
NOTESto CONSOLIDATED FINANCIAL STATEMENTS continued