Entergy 2006 Annual Report Download - page 2
Download and view the complete annual report
Please find page 2 of the 2006 Entergy annual report below. You can navigate through the pages in the report by either clicking on the pages listed below, or by using the keyword search tool below to find specific information within the annual report.-
 1
1 -
 2
2 -
 3
3 -
 4
4 -
 5
5 -
 6
6 -
 7
7 -
 8
8 -
 9
9 -
 10
10 -
 11
11 -
 12
12 -
 13
13 -
14
-
15
-
16
-
17
-
18
-
19
-
20
-
21
-
22
-
23
-
24
-
25
-
26
-
27
-
28
-
29
-
30
-
31
-
32
-
33
-
34
-
35
-
36
-
37
-
38
-
39
-
40
-
41
-
42
-
43
-
44
-
45
-
46
-
47
-
48
-
49
-
50
-
51
-
52
-
53
-
54
-
55
-
56
-
57
-
58
-
59
-
60
-
61
-
62
-
63
-
64
-
65
-
66
-
67
-
68
-
69
-
70
-
71
-
72
-
73
-
74
-
75
-
76
-
77
-
78
-
79
-
80
-
81
-
82
-
83
-
84
-
85
-
86
-
87
-
88
-
89
-
90
-
91
-
92
-
93
-
94
-
95
-
96
-
97
-
98
-
99
-
100
-
101
-
102
-
103
-
104
-
105
-
106
-
107
-
108
-
109
-
110
-
111
-
112
-
113
-
114
 |
 |

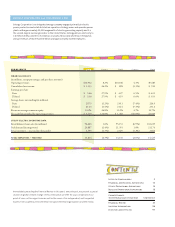
EENNTTEERRGGYY CCOORRPPOORRAATTIIOONN aanndd SSUUBBSSIIDDIIAARRIIEESS 22000066
Entergy Corporation is an integrated energy company engaged primarily in electric
power production and retail distribution operations. Entergy owns and operates power
plants with approximately 30,000 megawatts of electric generating capacity and it is
the second-largest nuclear generator in the United States. Entergy delivers electricity to
2.6 million utility customers in Arkansas, Louisiana, Mississippi and Texas. Entergy has
annual revenues of more than $10 billion and approximately 14,000 employees.
HIGHLIGHTS 2006 CHANGE 2005 CHANGE 2004
FINANCIAL RESULTS
(in millions, except percentages and per share amounts)
Operating revenues $10,932 8.2% $10,106 4.3% $9,685
Consolidated net income $ 1,133 26.2% $ 898 (1.3%) $ 910
Earnings per share
Basic $ 5.46 27.9% $ 4.27 6.5% $ 4.01
Diluted $ 5.36 27.9% $ 4.19 6.6% $ 3.93
Average shares outstanding (in millions)
Basic 207.5 (1.2%) 210.1 (7.4%) 226.9
Diluted 211.5 (1.4%) 214.4 (7.3%) 231.2
Return on average common equity 14.2% 26.8% 11.2% 4.7% 10.7%
Net cash flow provided by operating activities $ 3,419 132.9% $ 1,468 (49.9%) $2,929
UTILITY ELECTRIC OPERATING DATA
Retail kilowatt-hour sales (in millions) 96,663 1.6% 95,153 (6.9%) 102,225
Peak demand (in megawatts) 20,887 (2.4%) 21,391 1.0% 21,174
Retail customers – year end (in thousands) 2,595 (1.3%) 2,629 (1.2%) 2,662
TOTAL EMPLOYEES – YEAR END 13,814 (2.3%) 14,136 (2.0%) 14,425
Immediately preceding the Financial Review in this year’s annual report, we present a special
section on global climate change. In this centerpiece, we offer for your consideration our
point of view on this urgent issue as well as the views of six independent, well-respected
experts from academia, environmental non-governmental organizations and the media.
Letter to Stakeholders 2
Financial and Societal Aspirations 10
Utility Operational Aspirations 14
Nuclear Operational Aspirations 18
Climate Change:
The Defining Issue of Our Time Centerpiece
Financial Review 23
Investor Information 96
Directors and Officers 97