Entergy 2005 Annual Report Download - page 95
Download and view the complete annual report
Please find page 95 of the 2005 Entergy annual report below. You can navigate through the pages in the report by either clicking on the pages listed below, or by using the keyword search tool below to find specific information within the annual report.-
 1
1 -
2
-
3
-
4
-
5
-
6
-
7
-
8
-
9
-
10
-
11
-
12
-
13
-
14
-
15
-
16
-
17
-
18
-
19
-
20
-
21
-
22
-
23
-
24
-
25
-
26
-
27
-
28
-
29
-
30
-
31
-
32
-
33
-
34
-
35
-
36
-
37
-
38
-
39
-
40
-
41
-
42
-
43
-
44
-
45
-
46
-
47
-
48
-
49
-
50
-
51
-
52
-
53
-
54
-
55
-
56
-
57
-
58
-
59
-
60
-
61
-
62
-
63
-
64
-
65
-
66
-
67
-
68
-
69
-
70
-
71
-
72
-
73
-
74
-
75
-
76
-
77
-
78
-
79
-
80
-
81
-
82
-
83
-
84
-
 85
85 -
 86
86 -
 87
87 -
 88
88 -
 89
89 -
 90
90 -
 91
91 -
 92
92 -
 93
93 -
 94
94 -
 95
95 -
 96
96 -
 97
97 -
 98
98 -
 99
99 -
 100
100 -
 101
101 -
 102
102
 |
 |

ENTERGY CORPORATION AND SUBSIDIARIES 2005
*
91
NOTES to CONSOLIDATED FINANCIAL STATEMENTS continuedNOTES to CONSOLIDATED FINANCIAL STATEMENTS continued
Non-Utility
U.S. Utility Nuclear*All Other*Eliminations Consolidated
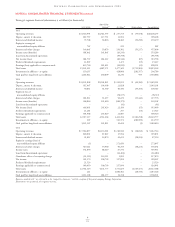
2005
Operating revenues $ 8,526,943 $1,421,547 $ 237,735 $ (79,978) $10,106,247
Deprec., amort. & decomm. 867,755 117,752 13,991 – 999,498
Interest and dividend income 75,748 66,836 78,185 (70,290) 150,479
Equity in earnings of
unconsolidated equity affiliates 765 – 220 – 985
Interest and other charges 364,665 50,874 130,302 (70,237) 475,604
Income taxes (benefits) 405,662 163,865 (10,243) – 559,284
Loss from discontinued operations – – (44,794) – (44,794)
Net income (loss) 681,767 282,622 (40,544) (87) 923,758
Preferred dividend requirements 22,007 – 3,475 (55) 25,427
Earnings (loss) applicable to common stock 659,760 282,622 (44,019) (32) 898,331
Total assets 25,242,432 4,887,572 3,477,169 (2,755,904) 30,851,269
Investments in affiliates – at equity 150,135 – 428,006 (281,357) 296,784
Cash paid for long-lived asset additions 1,285,012 160,899 11,230 945 1,458,086
2004
Operating revenues $ 8,142,808 $1,341,852 $ 265,051 $ (64,190) $ 9,685,521
Deprec., amort. & decomm. 915,667 106,408 21,028 – 1,043,103
Interest and dividend income 40,831 63,569 60,430 (55,195) 109,635
Equity in loss of
unconsolidated equity affiliates – – (78,727) – (78,727)
Interest and other charges 383,032 53,657 96,229 (55,142) 477,776
Income taxes (benefits) 406,864 142,620 (184,179) – 365,305
Loss from discontinued operations – – (41) – (41)
Net income (loss) 666,691 245,029 21,384 (55) 933,049
Preferred dividend requirements 23,283 – 297 (55) 23,525
Earnings applicable to common stock 643,408 245,029 21,087 – 909,524
Total assets 22,937,237 4,531,604 2,423,194 (1,581,258) 28,310,777
Investments in affiliates – at equity 207 – 512,571 (280,999) 231,779
Cash paid for long-lived asset additions 1,152,167 242,822 15,626 (5) 1,410,610
2003
Operating revenues $ 7,584,857 $1,274,983 $ 210,910 $ (38,036) $ 9,032,714
Deprec., amort. & decomm. 890,092 87,825 17,954 – 995,871
Interest and dividend income 43,035 36,874 45,651 (38,226) 87,334
Equity in earnings (loss) of
unconsolidated equity affiliates (3) – 271,650 – 271,647
Interest and other charges 419,111 34,460 90,295 (38,225) 505,641
Income taxes 341,044 88,619 67,770 – 497,433
Loss from discontinued operations – – (14,404) – (14,404)
Cumulative effect of accounting change (21,333) 154,512 3,895 – 137,074
Net income 492,574 300,799 157,094 – 950,467
Preferred dividend requirements 23,524 – – – 23,524
Earnings applicable to common stock 469,050 300,799 157,094 – 926,943
Total assets 22,402,314 4,171,777 3,572,824 (1,619,527) 28,527,388
Investments in affiliates – at equity 211 – 1,081,462 (28,345) 1,053,328
Cash paid for long-lived asset additions 1,233,208 281,377 54,358 – 1,568,943
Businesses marked with * are referred to as the “competitive businesses,” with the exception of the parent company, Entergy Corporation.
Eliminations are primarily intersegment activity.
Entergy’s segment financial information is as follows (in thousands):