Entergy 2005 Annual Report Download - page 62
Download and view the complete annual report
Please find page 62 of the 2005 Entergy annual report below. You can navigate through the pages in the report by either clicking on the pages listed below, or by using the keyword search tool below to find specific information within the annual report.-
 1
1 -
2
-
3
-
4
-
5
-
6
-
7
-
8
-
9
-
10
-
11
-
12
-
13
-
14
-
15
-
16
-
17
-
18
-
19
-
20
-
21
-
22
-
23
-
24
-
25
-
26
-
27
-
28
-
29
-
30
-
31
-
32
-
33
-
34
-
35
-
36
-
37
-
38
-
39
-
40
-
41
-
42
-
43
-
44
-
45
-
46
-
47
-
48
-
49
-
50
-
51
-
 52
52 -
 53
53 -
 54
54 -
 55
55 -
 56
56 -
 57
57 -
 58
58 -
 59
59 -
 60
60 -
 61
61 -
 62
62 -
 63
63 -
 64
64 -
 65
65 -
 66
66 -
 67
67 -
 68
68 -
 69
69 -
 70
70 -
 71
71 -
 72
72 -
73
-
74
-
75
-
76
-
77
-
78
-
79
-
80
-
81
-
82
-
83
-
84
-
85
-
86
-
87
-
88
-
89
-
90
-
91
-
92
-
93
-
94
-
95
-
96
-
97
-
98
-
99
-
100
-
101
-
102
 |
 |

ENTERGY CORPORATION AND SUBSIDIARIES 2005
*
58
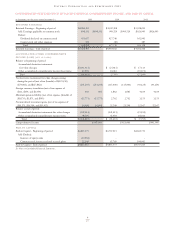
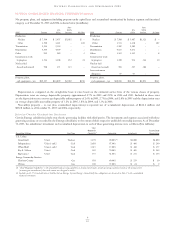
CONSOLIDATED BALANCE SHEETS
In thousands, as of December 31, 2005 2004
ASSETS
CURRENT ASSETS:
Cash and cash equivalents:
Cash $ 221,773 $ 79,136
Temporary cash investments – at cost, which approximates market 361,047 540,650
Total cash and cash equivalents 582,820 619,786
Other temporary investments – 187,950
Note receivable – Entergy New Orleans DIP loan 90,000 –
Notes receivable 3,227 3,092
Accounts receivable:
Customer 732,455 435,191
Allowance for doubtful accounts (30,805) (23,758)
Other 356,414 342,289
Accrued unbilled revenues 477,570 460,039
Total receivables 1,535,634 1,213,761
Deferred fuel costs 543,927 55,069
Accumulated deferred income taxes – 76,899
Fuel inventory – at average cost 206,195 127,251
Materials and supplies – at average cost 610,932 569,407
Deferred nuclear refueling outage costs 157,764 107,782
Prepayments and other 325,795 116,279
Total 4,056,294 3,077,276
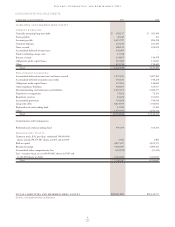
OTHER PROPERTY AND INVESTMENTS:
Investment in affiliates – at equity 296,784 231,779
Decommissioning trust funds 2,606,765 2,453,406
Non-utility property – at cost (less accumulated depreciation) 228,833 219,717
Other 81,535 90,992
Total 3,213,917 2,995,894
PROPERTY, PLANT AND EQUIPMENT:
Electric 29,161,027 29,053,340
Property under capital lease 727,565 738,554
Natural gas 86,794 262,787
Construction work in progress 1,524,085 1,197,551
Nuclear fuel under capital lease 271,615 262,469
Nuclear fuel 436,646 320,813
Total property, plant and equipment 32,207,732 31,835,514
Less – accumulated depreciation and amortization 13,010,687 13,139,883
Property, plant and equipment – net 19,197,045 18,695,631
DEFERRED DEBITS AND OTHER ASSETS:
Regulatory assets:
SFAS 109 regulatory asset – net 735,221 746,413
Other regulatory assets 2,133,724 1,429,261
Deferred fuel costs 120,489 30,842
Long-term receivables 25,572 39,417
Goodwill 377,172 377,172
Other 991,835 918,871
Total 4,384,013 3,541,976
TOTAL ASSETS $30,851,269 $28,310,777
See Notes to Consolidated Financial Statements.