Entergy 2005 Annual Report Download - page 39
Download and view the complete annual report
Please find page 39 of the 2005 Entergy annual report below. You can navigate through the pages in the report by either clicking on the pages listed below, or by using the keyword search tool below to find specific information within the annual report.-
 1
1 -
2
-
3
-
4
-
5
-
6
-
7
-
8
-
9
-
10
-
11
-
12
-
13
-
14
-
15
-
16
-
17
-
18
-
19
-
20
-
21
-
22
-
23
-
24
-
25
-
26
-
27
-
28
-
 29
29 -
 30
30 -
 31
31 -
 32
32 -
 33
33 -
 34
34 -
 35
35 -
 36
36 -
 37
37 -
 38
38 -
 39
39 -
 40
40 -
 41
41 -
 42
42 -
 43
43 -
 44
44 -
 45
45 -
 46
46 -
 47
47 -
 48
48 -
 49
49 -
50
-
51
-
52
-
53
-
54
-
55
-
56
-
57
-
58
-
59
-
60
-
61
-
62
-
63
-
64
-
65
-
66
-
67
-
68
-
69
-
70
-
71
-
72
-
73
-
74
-
75
-
76
-
77
-
78
-
79
-
80
-
81
-
82
-
83
-
84
-
85
-
86
-
87
-
88
-
89
-
90
-
91
-
92
-
93
-
94
-
95
-
96
-
97
-
98
-
99
-
100
-
101
-
102
 |
 |

ENTERGY CORPORATION AND SUBSIDIARIES 2005
*
35
Other regulatory charges (credits) have no material effect on net
income due to recovery and/or refund of such expenses. Other
regulatory credits decreased primarily due to the following:
■$32.4 million due to the over-recovery of costs through the
power management recovery rider at Entergy Mississippi as a
result of gains recorded on gas hedging contracts; and
■$22.6 million due to the over-recovery of Grand Gulf costs
through Grand Gulf riders at Entergy Arkansas and Entergy
Mississippi.
The decrease is partially offset by $24.8 million of higher deferrals
of capacity charges that are not currently recovered through base
rates but are expected to be recovered in the future. See Note 2 to
the consolidated financial statements for a discussion of the formula
rate plan filings that will be effective in 2006 for the 2005 test year
for Entergy Louisiana and the Louisiana jurisdiction of Entergy
Gulf States.
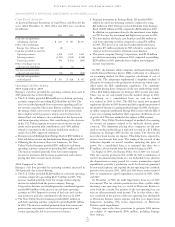
2004 Compared to 2003
Net revenue, which is Entergy’s measure of gross margin, consists of
operating revenues net of: 1) fuel, fuel-related expenses and gas pur-
chased for resale, 2) purchased power expenses, and 3) other regula-
tory credits. Following is an analysis of the change in net revenue
comparing 2004 to 2003 (in millions):
2003 net revenue $4,214.5
Volume/weather 68.3
Summer capacity charges 17.4
Base rates 10.6
Deferred fuel cost revisions (46.3)
Price applied to unbilled sales (19.3)
Other (1.2)
2004 net revenue $4,244.0
The volume/weather variance resulted primarily from increased
usage, partially offset by the effect of milder weather on sales during
2004 compared to 2003. Billed usage increased a total of 2,261
GWh in the industrial and commercial sectors.
The summer capacity charges variance was due to the amortiza-
tion in 2003 at Entergy Gulf States and Entergy Louisiana of
deferred capacity charges for the summer of 2001. Entergy Gulf
States’ amortization began in June 2002 and ended in May 2003.
Entergy Louisiana’s amortization began in August 2002 and ended
in July 2003.
Base rates increased net revenue due to a base rate increase at
Entergy New Orleans that became effective in June 2003.
The deferred fuel cost revisions variance resulted primarily from
a revision in 2003 to an unbilled sales pricing estimate to more
closely align the fuel component of that pricing with expected
recoverable fuel costs at Entergy Louisiana. Deferred fuel cost
revisions also decreased net revenue due to a revision in 2004 to the
estimate of fuel costs filed for recovery at Entergy Arkansas in
the March 2004 energy cost recovery rider.
The price applied to unbilled sales variance resulted from a
decrease in fuel price in 2004 caused primarily by the effect of
nuclear plant outages in 2003 on average fuel costs. See “Critical
Accounting Estimates – Unbilled Revenue” and Note 1 to
the consolidated financial statements for further discussion of the
accounting for unbilled revenues.
Gross operating revenues, fuel and purchased power expenses, and other
regulatory credits –Gross operating revenues include an increase in
fuel cost recovery revenues of $475 million and $18 million in
electric and gas sales, respectively, primarily due to higher fuel rates
in 2004 resulting from increases in the market prices of purchased
power and natural gas. As such, this revenue increase is offset by
increased fuel and purchased power expenses.
Other regulatory charges (credits) have no material effect on net
income due to recovery and/or refund of such expenses. Other
regulatory credits increased primarily due to the following:
■cessation of the Grand Gulf Accelerated Recovery Tariff that
was suspended in July 2003;
■the amortization in 2003 of deferred capacity charges for
summer 2001 power purchases at Entergy Gulf States and
Entergy Louisiana;
■the deferral in 2004 of $14.3 million of capacity charges related
to generation resource planning as allowed by the LPSC;
■the deferral in 2004 by Entergy Louisiana of $11.4 million
related to the voluntary severance program, in accordance
with a proposed stipulation entered into with the LPSC staff;
and
■the deferral in August 2004 of $7.5 million of fossil plant
maintenance and voluntary severance program costs at Entergy
New Orleans as a result of a stipulation approved by the
City Council.
Other Income Statement Variances
2005 Compared to 2004
Other operation and maintenance expenses increased slightly
from $1.467 billion in 2004 to $1.471 billion in 2005. The variance
includes the following:
■an increase of $9.5 million in nuclear expenses for contract and
material costs associated with maintenance outages and nuclear
refueling outage pre-work;
■an increase of $9.5 million in miscellaneous regulatory reserves;
■an increase of $7.6 million in storm reserves (unrelated to
Hurricanes Katrina and Rita);
■an increase of $5.1 million in estimated loss provisions recorded
for the bankruptcy of CashPoint, which managed a network of
payment agents for the domestic utility companies;
■an increase of $4.7 million in payroll and benefits costs which
includes higher pension and post-retirement benefit costs,
substantially offset by incentive compensation true-ups;
■a decrease of $18.2 million due to a shift in labor and material
costs from normal maintenance work to storm restoration work;
and
■a decrease of $15.7 million related to proceeds received from the
radwaste settlement, which is discussed further in “Significant
Factors and Known Trends – Central States Compact Claim.”
Taxes other than income taxes increased from $300.7 million in
2004 to $321.9 million in 2005 primarily due to higher employment
taxes and higher assessed values for ad valorem tax purposes in 2005.
Depreciation and amortization expenses decreased from $794.1
million in 2004 to $783.8 million in 2005 primarily due to a change
in the depreciation rate for Waterford 3 as approved by the LPSC
effective April 2005.
MANAGEMENT’S FINANCIAL DISCUSSION and ANALYSIS continued