Entergy 2005 Annual Report Download - page 40
Download and view the complete annual report
Please find page 40 of the 2005 Entergy annual report below. You can navigate through the pages in the report by either clicking on the pages listed below, or by using the keyword search tool below to find specific information within the annual report.-
 1
1 -
2
-
3
-
4
-
5
-
6
-
7
-
8
-
9
-
10
-
11
-
12
-
13
-
14
-
15
-
16
-
17
-
18
-
19
-
20
-
21
-
22
-
23
-
24
-
25
-
26
-
27
-
28
-
29
-
 30
30 -
 31
31 -
 32
32 -
 33
33 -
 34
34 -
 35
35 -
 36
36 -
 37
37 -
 38
38 -
 39
39 -
 40
40 -
 41
41 -
 42
42 -
 43
43 -
 44
44 -
 45
45 -
 46
46 -
 47
47 -
 48
48 -
 49
49 -
 50
50 -
51
-
52
-
53
-
54
-
55
-
56
-
57
-
58
-
59
-
60
-
61
-
62
-
63
-
64
-
65
-
66
-
67
-
68
-
69
-
70
-
71
-
72
-
73
-
74
-
75
-
76
-
77
-
78
-
79
-
80
-
81
-
82
-
83
-
84
-
85
-
86
-
87
-
88
-
89
-
90
-
91
-
92
-
93
-
94
-
95
-
96
-
97
-
98
-
99
-
100
-
101
-
102
 |
 |

ENTERGY CORPORATION AND SUBSIDIARIES 2005
*
36
Other income decreased from $134 million in 2004 to
$111.2 million in 2005 primarily due to:
■a revision in 2004 to the estimated decommissioning cost liability
for River Bend in accordance with a new decommissioning
cost study that reflected a life extension for the plant. For the
portion of River Bend not subject to cost-based ratemaking, the
revised estimate resulted in the elimination of the asset retire-
ment cost that had been recorded at the time of adoption of
SFAS 143 with the remainder recorded as miscellaneous income
of $27.7 million;
■a decrease of $26.3 million in Entergy New Orleans earnings,
which is now reported as an unconsolidated equity affiliate for
2005 in the “Equity in earnings (loss) of unconsolidated equity
affiliates” line on the Income Statement. The decrease in Entergy
New Orleans earnings is primarily a result of lower net revenue
and higher depreciation and amortization expenses, partially offset
by lower other operation and maintenance expenses and lower
interest charges; and
■a decrease of $10.1 million at Entergy Gulf States due to a
reduction in 2004 in the loss provision for an environmental
clean-up site.
The decrease was partially offset by an increase of $35.3 million
in interest and dividend income due to both the proceeds from
the radwaste settlement, which is discussed further in “Significant
Factors and Known Trends – Central States Compact Claim,” and
increased interest on temporary cash investments.
2004 Compared to 2003
Other operation and maintenance expenses decreased from $1.613 billion
in 2003 to $1.569 billion in 2004 primarily due to voluntary severance
program accruals of $99.8 million in 2003, partially offset by an
increase of $30.5 million as a result of higher customer service support
costs in 2004 and an increase of approximately $33 million as a result
of higher benefits costs in 2004. See “Critical Accounting Estimates –
Pension and Other Retirement Benefits” and Note 10 to the consoli-
dated financial statements for further discussion of benefit costs.
Depreciation and amortization expenses increased from $797.6
million in 2003 to $823.7 million in 2004 primarily due to higher
depreciation of Grand Gulf due to a higher scheduled sale-leaseback
principal payment in addition to an increase in plant in service.
Other income (deductions) changed from ($36.0 million) in 2003
to $108.9 million in 2004 primarily due to the following:
■the $107.7 million accrual in the second quarter of 2003 for
the loss that would be associated with a final, non-appealable
decision disallowing abeyed River Bend plant costs. See Note 2
to the consolidated financial statements for more details
regarding the River Bend abeyed plant costs;
■a reduction in the decommissioning liability for River Bend
in 2004, as discussed in Note 8 to the consolidated financial
statements; and
■a $10 million reduction in the loss provision for an Entergy
Gulf States environmental clean-up site.
Interest on long-term debt decreased from $433.5 million in 2003
to $390.7 million in 2004 primarily due to the net retirement and
refinancing of long-term debt in 2003 and the first six months of
2004. See Note 5 to the consolidated financial statements for details
on long-term debt.
NON-UTILITY NUCLEAR
Following are key performance measures for Non-Utility Nuclear:
2005 2004 2003
Net MW in operation at December 31 4,105 4,058 4,001
Average realized price per MWh $42.39 $41.26 $39.38
Generation in GWh for the year 33,539 32,524 32,379
Capacity factor for the year 93% 92% 92%
Results of Operations
2005 Compared to 2004
The increase in earnings for Non-Utility Nuclear from $245 million
in 2004 to $282.6 million in 2005 was primarily due to the following:
■higher revenues, which increased from $1.342 billion in 2004 to
$1.422 billion in 2005, primarily resulting from higher pricing
in its contracts to sell power. Also contributing to the increase in
revenues was increased generation in 2005 due to power uprates
at several plants completed in 2004 and 2005 and fewer planned
and unplanned outages in 2005; and
■miscellaneous income of $15.8 million net-of-tax resulting from
a reduction in the decommissioning liability for a plant in 2005,
as discussed in Note 8 to the consolidated financial statements.
The increase in earnings was partially offset by the following:
■higher fuel and purchased power expenses, which increased
from $125.7 million in 2004 to $147.9 million in 2005; and
■miscellaneous income of $11.9 million net-of-tax resulting from
a reduction in the decommissioning liability for a plant in 2004,
as discussed in Note 8 to the consolidated financial statements.
2004 Compared to 2003
The decrease in earnings for Non-Utility Nuclear from $300.8 million
in 2003 to $245 million in 2004 was primarily due to the $154.5 mil-
lion net-of-tax cumulative effect of a change in accounting principle
that increased earnings in the first quarter of 2003 upon implementa-
tion of SFAS 143. See “Critical Accounting Estimates – Nuclear
Decommissioning Costs” below for discussion of the implementation
of SFAS 143. Earnings before the cumulative effect of accounting
change increased by $98.7 million primarily due to the following:
■lower operation and maintenance expenses, which decreased
from $681.8 million in 2003 to $595.7 million in 2004, primarily
resulting from charges recorded in 2003 in connection with the
voluntary severance program;
■higher revenues, which increased from $1.275 billion in 2003 to
$1.342 billion in 2004, primarily resulting from higher contract
pricing. The addition of a support services contract for the Cooper
Nuclear Station and increased generation in 2004 due to power
uprates completed in 2003 and fewer planned and unplanned out-
ages in 2004 also contributed to the higher revenues; and
■miscellaneous income of $11.9 million net-of-tax resulting from
a reduction in the decommissioning liability for a plant, as
discussed in Note 8 to the consolidated financial statements.
Partially offsetting this increase were the following:
■higher income taxes, which increased from $88.6 million in
2003 to $142.6 million in 2004; and
■higher depreciation expense, which increased from $34.3 million in
2003 to $48.9 million in 2004, due to additions to plant in service.
MANAGEMENT’S FINANCIAL DISCUSSION and ANALYSIS continued
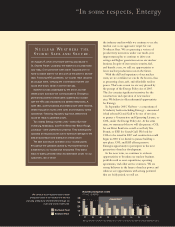
The increase in earnings for Non-Utility Nuclear
to $282.6 million in 2005 was due primarily
to higher revenues resulting from
higher contract pricing and increased generation.
<
>