Entergy 2005 Annual Report Download - page 61
Download and view the complete annual report
Please find page 61 of the 2005 Entergy annual report below. You can navigate through the pages in the report by either clicking on the pages listed below, or by using the keyword search tool below to find specific information within the annual report.-
 1
1 -
2
-
3
-
4
-
5
-
6
-
7
-
8
-
9
-
10
-
11
-
12
-
13
-
14
-
15
-
16
-
17
-
18
-
19
-
20
-
21
-
22
-
23
-
24
-
25
-
26
-
27
-
28
-
29
-
30
-
31
-
32
-
33
-
34
-
35
-
36
-
37
-
38
-
39
-
40
-
41
-
42
-
43
-
44
-
45
-
46
-
47
-
48
-
49
-
50
-
 51
51 -
 52
52 -
 53
53 -
 54
54 -
 55
55 -
 56
56 -
 57
57 -
 58
58 -
 59
59 -
 60
60 -
 61
61 -
 62
62 -
 63
63 -
 64
64 -
 65
65 -
 66
66 -
 67
67 -
 68
68 -
 69
69 -
 70
70 -
 71
71 -
72
-
73
-
74
-
75
-
76
-
77
-
78
-
79
-
80
-
81
-
82
-
83
-
84
-
85
-
86
-
87
-
88
-
89
-
90
-
91
-
92
-
93
-
94
-
95
-
96
-
97
-
98
-
99
-
100
-
101
-
102
 |
 |

ENTERGY CORPORATION AND SUBSIDIARIES 2005
*
57
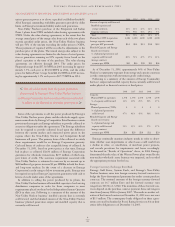
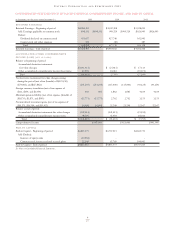
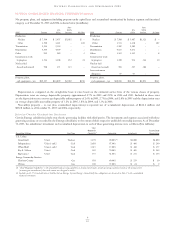
CONSOLIDATED STATEMENTS OF RETAINED EARNINGS, COMPREHENSIVE INCOME, AND PAID-IN CAPITAL
In thousands, for the years ended December 31, 2005 2004 2003
RETAINED EARNINGS
Retained Earnings – Beginning of period $4,984,302 $4,502,508 $3,938,693
Add: Earnings applicable to common stock 898,331 $ 898,331 909,524 $ 909,524 $ 926,943 $926,943
Deduct:
Dividends declared on common stock 453,657 427,740 362,941
Capital stock and other expenses 569 (10) 187
Total 454,226 427,730 363,128
Retained Earnings – End of period $5,428,407 $4,984,302 $4,502,508
ACCUMULATED OTHER COMPREHENSIVE
INCOME (LOSS) (NET OF TAXES):
Balance at beginning of period:
Accumulated derivative instrument
fair value changes $ (141,411) $ (25,811) $ 17,313
Other accumulated comprehensive income (loss) items 47,958 18,016 (39,673)
Total (93,453) (7,795) (22,360)
Net derivative instrument fair value changes arising
during the period (net of tax (benefit) of $(159,236),
$(74,082), and $(27,862)) (251,203) (251,203) (115,600) (115,600) (43,124) (43,124)
Foreign currency translation (net of tax expense of
$211, $659, and $1,459) 602 602 1,882 1,882 4,169 4,169
Minimum pension liability (net of tax expense (benefit) of
$(9,176), $1,875, and $503) (15,773) (15,773) 2,762 2,762 1,153 1,153
Net unrealized investment gains (net of tax expense of
$10,573, $16,599, and $33,422) 16,008 16,008 25,298 25,298 52,367 52,367
Balance at end of period:
Accumulated derivative instrument fair value changes (392,614) (141,411) (25,811)
Other accumulated comprehensive income items 48,795 47,958 18,016
Total $ (343,819) $ (93,453) $ (7,795)
Comprehensive Income $ 647,965 $ 823,866 $941,508
PAID-IN CAPITAL
Paid-in Capital – Beginning of period $4,835,375 $4,767,615 $4,666,753
Add (Deduct):
Issuance of equity units (39,904) – –
Common stock issuances related to stock plans 22,166 67,760 100,862
Paid-in Capital – End of period $4,817,637 $4,835,375 $4,767,615
See Notes to Consolidated Financial Statements.