Entergy 2005 Annual Report Download - page 45
Download and view the complete annual report
Please find page 45 of the 2005 Entergy annual report below. You can navigate through the pages in the report by either clicking on the pages listed below, or by using the keyword search tool below to find specific information within the annual report.-
 1
1 -
2
-
3
-
4
-
5
-
6
-
7
-
8
-
9
-
10
-
11
-
12
-
13
-
14
-
15
-
16
-
17
-
18
-
19
-
20
-
21
-
22
-
23
-
24
-
25
-
26
-
27
-
28
-
29
-
30
-
31
-
32
-
33
-
34
-
 35
35 -
 36
36 -
 37
37 -
 38
38 -
 39
39 -
 40
40 -
 41
41 -
 42
42 -
 43
43 -
 44
44 -
 45
45 -
 46
46 -
 47
47 -
 48
48 -
 49
49 -
 50
50 -
 51
51 -
 52
52 -
 53
53 -
 54
54 -
 55
55 -
56
-
57
-
58
-
59
-
60
-
61
-
62
-
63
-
64
-
65
-
66
-
67
-
68
-
69
-
70
-
71
-
72
-
73
-
74
-
75
-
76
-
77
-
78
-
79
-
80
-
81
-
82
-
83
-
84
-
85
-
86
-
87
-
88
-
89
-
90
-
91
-
92
-
93
-
94
-
95
-
96
-
97
-
98
-
99
-
100
-
101
-
102
 |
 |

ENTERGY CORPORATION AND SUBSIDIARIES 2005
*
41
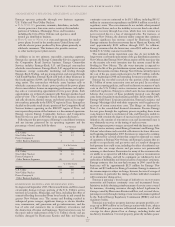
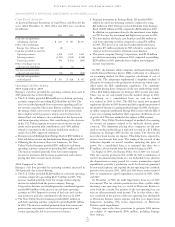
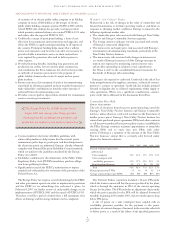
CASH FLOW ACTIVITY
As shown in Entergy’s Statements of Cash Flows, cash flows for the
years ended December 31, 2005, 2004, and 2003 were as follows
(in millions):
2005 2004 2003
Cash and cash equivalents
at beginning of period $ 620 $ 507 $1,335
Effect of deconsolidating
Entergy New Orleans in 2005 (8) – –
Cash flow provided by (used in):
Operating activities 1,468 2,929 2,006
Investing activities (1,992) (1,143) (1,968)
Financing activities 496 (1,672) (869)
Effect of exchange rates on
cash and cash equivalents (1) (1) 3
Net increase (decrease) in
cash and cash equivalents (29) 113 (828)
Cash and cash equivalents
at end of period $ 583 $ 620 $ 507
Operating Cash Flow Activity
2005 Compared to 2004
Entergy’s cash flow provided by operating activities decreased in
2005 primarily due to the following:
■The U.S. Utility provided $964 million in cash from operating
activities compared to providing $2,208 million in 2004. The
decrease resulted primarily from restoration spending and lost
net revenue caused by Hurricanes Katrina and Rita. Changes in
the timing of fuel cost recovery compared to the prior period
due to higher natural gas prices, which caused an increase in
deferred fuel cost balances, also contributed to the decrease in
cash from operating activities. Also contributing to the decrease
in the U.S. Utility segment were increases in income tax pay-
ments and in pension plan contributions, and a $90 million
refund to customers in the Louisiana jurisdiction made as a
result of an LPSC-approved settlement.
■Entergy received dividends from Entergy-Koch of $529 million in
2004 and did not receive any dividends from Entergy-Koch in 2005.
■Offsetting the decreases in those two businesses, the Non-
Utility Nuclear business provided $551 million in cash from
operating activities compared to providing $415 million in 2004.
The increase resulted primarily from lower intercompany
income tax payments and increases in generation and contract
pricing that led to an increase in revenues.
2004 Compared to 2003
Entergy’s cash flow provided by operating activities increased in
2004 primarily due to the following:
■The U.S. Utility provided $2,208 million in cash from operating
activities compared to providing $1,675 million in 2003. The
increase resulted primarily from the receipt of intercompany
income tax refunds from the parent company, Entergy
Corporation. Income tax refunds/payments contributed approxi-
mately $400 million of the increase in cash from operating
activities in 2004. Improved recovery of fuel costs and a reduc-
tion in interest paid also contributed to the increase in 2004.
■The Non-Utility Nuclear business provided $415 million in
cash from operating activities compared to providing $183 million
in 2003. The increase resulted primarily from lower intercom-
pany income tax payments and increases in generation and
contract pricing that led to an increase in revenues.
■Entergy’s investment in Entergy-Koch, LP provided $526
million in cash from operating activities compared to using
$41 million in 2003. Entergy received dividends from Entergy-
Koch of $529 million in 2004 compared to $100 million in 2003.
In addition, tax payments related to the investment were higher
in 2003 because the investment had higher net income in 2003.
■The non-nuclear wholesale asset business used $46 million in
cash from operating activities compared to using $70 million
in 2003. The decrease in cash used resulted primarily from a
one-time $33 million payment in 2003 related to a generation
contract in the non-nuclear wholesale assets business.
■The parent company, Entergy Corporation, used $146 million
in cash from operating activities in 2004 compared to providing
$209 million in 2003 primarily due to higher intercompany
income tax payments.
In 2003, the domestic utility companies and System Energy filed,
with the Internal Revenue Service (IRS), notification of a change in
tax accounting method for their respective calculations of cost of
goods sold. The adjustment implemented a simplified method of
allocation of overhead to the production of electricity, which is pro-
vided under the IRS capitalization regulations. The cumulative
adjustment placing these companies on the new methodology result-
ed in a $2.8 billion deduction on Entergy’s 2003 income tax return.
There was no tax cash benefit from the method change in 2003.
In addition, on a consolidated basis, no cash tax benefit
was realized in 2004 or 2005. The IRS has issued new proposed
regulations effective in 2005 that may preclude a significant portion of
the benefit of this tax accounting method change. In 2005, the domes-
tic utility companies and System Energy filed a notice with the IRS of
a new tax accounting method for their respective calculations of cost
of goods sold. This new method is also subject to IRS scrutiny.
In 2005, Non-Utility Nuclear changed its method of accounting
for income tax purposes related to its wholesale electric power
contracts. The adjustment placing these companies on the new
mark-to-market methodology is expected to result in a $3.8 billion
deduction on Entergy’s 2005 income tax return. The election did
not reduce book income tax expense. This deduction is expected to
reverse over the next four years. The timing of the reversal of this
deduction depends on several variables, including the price of
power. On a consolidated basis, it is estimated that there was a
$7 million cash tax benefit from the method change in 2005.
In August of 2005, the Energy Policy Act of 2005 was enacted.
This Act contains provisions that enable the full accumulation of
nuclear decommissioning funds on a tax deductible basis, shortens
the depreciation recovery period for certain transmission capital
expenditures, provides a production credit for electricity generated
by new nuclear plants, and expands the net operating loss carryback
period to five years for 2003, 2004, and 2005 losses to the extent of
20% of transmission capital expenditures incurred in 2005, 2006,
and 2007.
In December of 2005, the Gulf Opportunity Zone Act of 2005
was enacted. The Act contains provisions that allow a public utility
incurring a net operating loss as a result of Hurricane Katrina to
carry back the casualty loss portion of the net operating loss ten
years to offset previously taxed income. The Act also allows a five-
year carryback of the portion of the net operating loss attributable
to Hurricane Katrina repairs expense and first year depreciation
deductions, including 50% bonus depreciation, on Hurricane
Katrina capital expenditures.
Entergy expects the above provisions to generate 2006 income
tax refunds of approximately $300 million, including Entergy
New Orleans.
MANAGEMENT’S FINANCIAL DISCUSSION and ANALYSIS continued