Entergy 2005 Annual Report Download - page 68
Download and view the complete annual report
Please find page 68 of the 2005 Entergy annual report below. You can navigate through the pages in the report by either clicking on the pages listed below, or by using the keyword search tool below to find specific information within the annual report.-
 1
1 -
2
-
3
-
4
-
5
-
6
-
7
-
8
-
9
-
10
-
11
-
12
-
13
-
14
-
15
-
16
-
17
-
18
-
19
-
20
-
21
-
22
-
23
-
24
-
25
-
26
-
27
-
28
-
29
-
30
-
31
-
32
-
33
-
34
-
35
-
36
-
37
-
38
-
39
-
40
-
41
-
42
-
43
-
44
-
45
-
46
-
47
-
48
-
49
-
50
-
51
-
52
-
53
-
54
-
55
-
56
-
57
-
 58
58 -
 59
59 -
 60
60 -
 61
61 -
 62
62 -
 63
63 -
 64
64 -
 65
65 -
 66
66 -
 67
67 -
 68
68 -
 69
69 -
 70
70 -
 71
71 -
 72
72 -
 73
73 -
 74
74 -
 75
75 -
 76
76 -
 77
77 -
 78
78 -
79
-
80
-
81
-
82
-
83
-
84
-
85
-
86
-
87
-
88
-
89
-
90
-
91
-
92
-
93
-
94
-
95
-
96
-
97
-
98
-
99
-
100
-
101
-
102
 |
 |

ENTERGY CORPORATION AND SUBSIDIARIES 2005
*
64
NUCLEAR REFUELING OUTAGE COSTS
Entergy records nuclear refueling outage costs in accordance with
regulatory treatment and the matching principle. These refueling
outage expenses are incurred to prepare the units to operate for the
next operating cycle without having to be taken off line. Except for
the River Bend plant, the costs are deferred during the outage and
amortized over the period to the next outage. In accordance with the
regulatory treatment of the River Bend plant, River Bend’s costs are
accrued in advance and included in the cost of service used to estab-
lish retail rates. Entergy Gulf States relieves the accrued liability
when it incurs costs during the next River Bend outage.
ALLOWANCE FOR FUNDS USED DURING
CONSTRUCTION (AFUDC)
AFUDC represents the approximate net composite interest cost of
borrowed funds and a reasonable return on the equity funds used for
construction in the U.S. Utility segment. Although AFUDC
increases both the plant balance and earnings, it is realized in cash
through depreciation provisions included in rates.
INCOME TAXES
Entergy Corporation and the majority of its subsidiaries file a
United States consolidated federal income tax return. Entergy
Louisiana, LLC, formed December 31, 2005, is not a member of the
consolidated group and files a separate federal income tax return.
Income taxes are allocated to the subsidiaries in proportion to
their contribution to consolidated taxable income. In accordance
with Statement of Financial Accounting Standards (SFAS) 109,
“Accounting for Income Taxes,” deferred income taxes are recorded
for all temporary differences between the book and tax basis of assets
and liabilities, and for certain credits available for carryforward.
Deferred tax assets are reduced by a valuation allowance when, in
the opinion of management, it is more likely than not that some
portion of the deferred tax assets will not be realized. Deferred tax
assets and liabilities are adjusted for the effects of changes in tax laws
and rates in the period in which the tax or rate was enacted.
Investment tax credits are deferred and amortized based upon the
average useful life of the related property, in accordance with
ratemaking treatment.
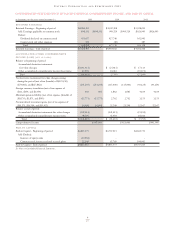
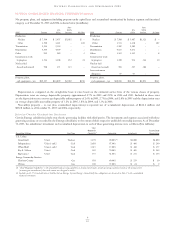
EARNINGS PER SHARE
The following table presents Entergy’s basic and diluted earnings
per share (EPS) calculation included on the consolidated income
statement (in millions, except per share data):
For the years ended December 31, 2005 2004 2003
$/share $/share $/share
Income from continuing
operations before cumulative
effect of accounting changes $943.1 $909.6 $804.3
Average number of common
shares outstanding – basic 210.1 $4.49 226.9 $4.01 226.8 $3.55
Average dilutive effect of:
Stock Options(1) 4.0 (0.085) 4.1 (0.071) 4.1 (0.063)
Deferred Units 0.3 (0.006) 0.2 (0.004) 0.2 (0.003)
Average number of common
shares outstanding – diluted 214.4 $4.40 231.2 $3.93 231.1 $3.48
Earnings applicable to
common stock $898.3 $909.5 $926.9
Average number of common
shares outstanding – basic 210.1 $4.27 226.9 $4.01 226.8 $4.09
Average dilutive effect of:
Stock Options(1) 4.0 (0.081) 4.1 (0.071) 4.1 (0.073)
Deferred Units 0.3 (0.005) 0.2 (0.004) 0.2 (0.004)
Average number of common
shares outstanding – diluted 214.4 $4.19 231.2 $3.93 231.1 $4.01
(1) Options to purchase approximately 1,727,579 common stock shares in 2005, 3,319
common stock shares in 2004, and 15,231 common stock shares in 2003 at various
prices were outstanding at the end of those years that were not included in the
computation of diluted earnings per share because the exercise prices were greater
than the common share average market price at the end of each of the years presented.
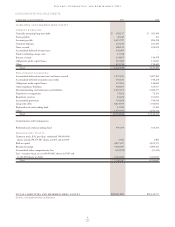
STOCK-BASED COMPENSATION PLANS
Entergy grants stock options to key employees of the Entergy sub-
sidiaries, which is described more fully in Note 7 to the consolidated
financial statements. Effective January 1, 2003, Entergy prospec-
tively adopted the fair value based method of accounting for stock
options prescribed by SFAS 123, “Accounting for Stock-Based
Compensation.” Awards under Entergy’s plans vest over three years.
Therefore, the cost related to stock-based employee compensation
included in the determination of net income for 2004 and 2003 is
less than that which would have been recognized if the fair value
based method had been applied to all awards since the original effec-
tive date of SFAS 123. There is no pro forma effect for 2005 because
all non-vested awards are accounted for at fair value. Stock-based
compensation expense included in earnings applicable to common
stock, net of related tax effects, for 2005 is $7.8 million. The follow-
ing table illustrates the effect on net income and earnings per share
if Entergy would have historically applied the fair value based
method of accounting to stock-based employee compensation (in
thousands, except per share data):
For the years ended December 31, 2004 2003
Earnings applicable
to common stock $909,524 $926,943
Add back: Stock-based compensation
expense included in earnings
applicable to common stock, net
of related tax effects 5,141 2,818
Deduct: Total stock-based employee
compensation expense determined
under fair value method for all
awards, net of related tax effects 16,668 24,518
Pro forma earnings applicable
to common stock $897,997 $905,243
Earnings per average common share:
Basic $4.01 $4.09
Basic – pro forma $3.96 $3.99
Diluted $3.93 $4.01
Diluted – pro forma $3.88 $3.92
NOTES to CONSOLIDATED FINANCIAL STATEMENTS continued