Entergy 2005 Annual Report Download - page 60
Download and view the complete annual report
Please find page 60 of the 2005 Entergy annual report below. You can navigate through the pages in the report by either clicking on the pages listed below, or by using the keyword search tool below to find specific information within the annual report.-
 1
1 -
2
-
3
-
4
-
5
-
6
-
7
-
8
-
9
-
10
-
11
-
12
-
13
-
14
-
15
-
16
-
17
-
18
-
19
-
20
-
21
-
22
-
23
-
24
-
25
-
26
-
27
-
28
-
29
-
30
-
31
-
32
-
33
-
34
-
35
-
36
-
37
-
38
-
39
-
40
-
41
-
42
-
43
-
44
-
45
-
46
-
47
-
48
-
49
-
 50
50 -
 51
51 -
 52
52 -
 53
53 -
 54
54 -
 55
55 -
 56
56 -
 57
57 -
 58
58 -
 59
59 -
 60
60 -
 61
61 -
 62
62 -
 63
63 -
 64
64 -
 65
65 -
 66
66 -
 67
67 -
 68
68 -
 69
69 -
 70
70 -
71
-
72
-
73
-
74
-
75
-
76
-
77
-
78
-
79
-
80
-
81
-
82
-
83
-
84
-
85
-
86
-
87
-
88
-
89
-
90
-
91
-
92
-
93
-
94
-
95
-
96
-
97
-
98
-
99
-
100
-
101
-
102
 |
 |

ENTERGY CORPORATION AND SUBSIDIARIES 2005
*
56
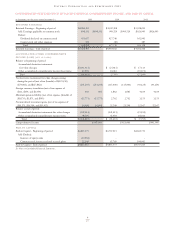
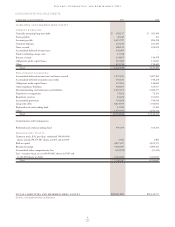
CONSOLIDATED STATEMENTS OF INCOME
In thousands, except share data, for the years ended December 31, 2005 2004 2003
OPERATING REVENUES:
Domestic electric $ 8,446,830 $7,932,577 $7,397,175
Natural gas 77,660 208,499 186,176
Competitive businesses 1,581,757 1,544,445 1,449,363
Total 10,106,247 9,685,521 9,032,714
OPERATING EXPENSES:
Operating and Maintenance:
Fuel, fuel-related expenses, and gas purchased for resale 2,176,015 2,488,208 1,987,217
Purchased power 2,521,247 1,701,610 1,579,057
Nuclear refueling outage expenses 162,653 166,072 159,995
Provision for asset impairments
and restructuring charges – 55,000 (7,743)
Other operation and maintenance 2,122,206 2,268,332 2,423,951
Decommissioning 143,121 149,529 146,100
Taxes other than income taxes 382,521 403,635 402,571
Depreciation and amortization 856,377 893,574 849,771
Other regulatory credits – net (49,882) (90,611) (13,761)
Total 8,314,258 8,035,349 7,527,158
OPERATING INCOME 1,791,989 1,650,172 1,505,556
OTHER INCOME:
Allowance for equity funds used during construction 45,736 39,582 42,710
Interest and dividend income 150,479 109,635 87,334
Equity in earnings (loss) of unconsolidated equity affiliates 985 (78,727) 271,647
Miscellaneous – net 14,251 55,509 (76,376)
Total 211,451 125,999 325,315
INTEREST AND OTHER CHARGES:
Interest on long-term debt 440,334 463,384 485,964
Other interest – net 64,646 40,133 52,868
Allowance for borrowed funds used during construction (29,376) (25,741) (33,191)
Total 475,604 477,776 505,641
INCOME FROM CONTINUING OPERATIONS
BEFORE INCOME TAXES AND CUMULATIVE
EFFECT OF ACCOUNTING CHANGES 1,527,836 1,298,395 1,325,230
Income taxes 559,284 365,305 497,433
INCOME FROM CONTINUING OPERATIONS
BEFORE CUMULATIVE EFFECT OF ACCOUNTING CHANGES 968,552 933,090 827,797
LOSS FROM DISCONTINUED OPERATIONS (net of income
tax expense (benefit) of $(24,051), $603, and $(7,359), respectively) (44,794) (41) (14,404)
CUMULATIVE EFFECT OF ACCOUNTING CHANGES
(net of income tax expense of $89,925) – – 137,074
CONSOLIDATED NET INCOME 923,758 933,049 950,467
Preferred dividend requirements and other 25,427 23,525 23,524
EARNINGS APPLICABLE TO COMMON STOCK $ 898,331 $ 909,524 $ 926,943
Basic earnings (loss) per average common share:
Continuing operations $ 4.49 $4.01 $ 3.55
Discontinued operations $(0.21) – $(0.06)
Cumulative effect of accounting changes – – $ 0.60
Basic earnings per average common share $ 4.27 $4.01 $ 4.09
Diluted earnings (loss) per average common share:
Continuing operations $ 4.40 $3.93 $ 3.48
Discontinued operations $(0.21) – $(0.06)
Cumulative effect of accounting changes – – $ 0.59
Diluted earnings per average common share $ 4.19 $3.93 $ 4.01
Dividends declared per common share $ 2.16 $1.89 $ 1.60
Basic average number of common shares outstanding 210,141,887 226,863,758 226,804,370
Diluted average number of common shares outstanding 214,441,362 231,193,686 231,146,040
See Notes to Consolidated Financial Statements.