Entergy 2005 Annual Report Download - page 52
Download and view the complete annual report
Please find page 52 of the 2005 Entergy annual report below. You can navigate through the pages in the report by either clicking on the pages listed below, or by using the keyword search tool below to find specific information within the annual report.-
 1
1 -
2
-
3
-
4
-
5
-
6
-
7
-
8
-
9
-
10
-
11
-
12
-
13
-
14
-
15
-
16
-
17
-
18
-
19
-
20
-
21
-
22
-
23
-
24
-
25
-
26
-
27
-
28
-
29
-
30
-
31
-
32
-
33
-
34
-
35
-
36
-
37
-
38
-
39
-
40
-
41
-
 42
42 -
 43
43 -
 44
44 -
 45
45 -
 46
46 -
 47
47 -
 48
48 -
 49
49 -
 50
50 -
 51
51 -
 52
52 -
 53
53 -
 54
54 -
 55
55 -
 56
56 -
 57
57 -
 58
58 -
 59
59 -
 60
60 -
 61
61 -
 62
62 -
63
-
64
-
65
-
66
-
67
-
68
-
69
-
70
-
71
-
72
-
73
-
74
-
75
-
76
-
77
-
78
-
79
-
80
-
81
-
82
-
83
-
84
-
85
-
86
-
87
-
88
-
89
-
90
-
91
-
92
-
93
-
94
-
95
-
96
-
97
-
98
-
99
-
100
-
101
-
102
 |
 |

ENTERGY CORPORATION AND SUBSIDIARIES 2005
*
48
unit to generate power at or above a specified availability threshold.
All of Entergy’s outstanding availability guarantees provide for dollar
limits on Entergy’s maximum liability under such guarantees.
Non-Utility Nuclear’s purchase of the Fitzpatrick and Indian
Point 3 plants from NYPA included value sharing agreements with
NYPA. Under the value sharing agreements, to the extent that the
average annual price of the energy sales from each of the two plants
exceeds specified strike prices, the Non-Utility Nuclear business
will pay 50% of the amount exceeding the strike prices to NYPA.
These payments, if required, will be recorded as adjustments to the
purchase price of the plants. The annual energy sales subject to the
value sharing agreements are limited to the lesser of actual genera-
tion or generation assuming an 85% capacity factor based on the
plants’ capacities at the time of the purchase. The value sharing
agreements are effective through 2014. The strike prices for
Fitzpatrick range from $37.51/MWh in 2005 increasing by approx-
imately 3.5% each year to $51.30/MWh in 2014, and the strike
prices for Indian Point 3 range from $42.26/MWh in 2005 increas-
ing by approximately 3.5% each year to $57.77/MWh in 2014.
Some of the agreements to sell the power produced by Entergy’s
Non-Utility Nuclear power plants and the wholesale supply agree-
ments entered into by Entergy’s Competitive Retail business contain
provisions that require an Entergy subsidiary to provide collateral to
secure its obligations under the agreements. The Entergy subsidiary
may be required to provide collateral based upon the difference
between the current market and contracted power prices in the
regions where the Non-Utility Nuclear and Competitive Retail
businesses sell power. The primary form of the collateral to satisfy
these requirements would be an Entergy Corporation guaranty.
Cash and letters of credit are also acceptable forms of collateral. At
December 31, 2005, based on power prices at that time, Entergy
had in place as collateral $1,630 million of Entergy Corporation
guarantees for wholesale transactions, $237 million of which sup-
port letters of credit. The assurance requirement associated with
Non-Utility Nuclear is estimated to increase by an amount up to
$400 million if gas prices increase $1 per MMBtu in both the short-
and long-term markets. In the event of a decrease in Entergy
Corporation’s credit rating to below investment grade, Entergy may
be required to replace Entergy Corporation guarantees with cash or
letters of credit under some of the agreements.
In addition to selling the power produced by its plants, the
Non-Utility Nuclear business sells installed capacity to load-serving
distribution companies in order for those companies to meet
requirements placed on them by the Independent System Operator
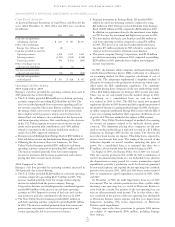
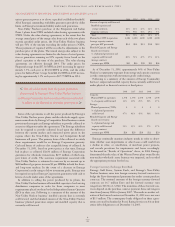
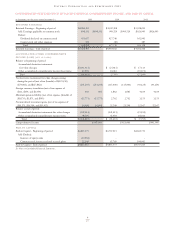
(ISO) in their area. Following is a summary of the amount of the
Non-Utility Nuclear business’ installed capacity that is currently
sold forward, and the blended amount of the Non-Utility Nuclear
business’ planned generation output and installed capacity that is
currently sold forward:
2006 2007 2008 2009 2010
Percent of capacity sold forward:
Bundled capacity and
energy contracts 12% 12% 12% 12% 12%
Capacity contracts 77% 46% 36% 24% 3%
Total 89% 58% 48% 36% 15%
Planned net MW in operation 4,184 4,200 4,200 4,200 4,200
Average capacity contract
price per kW per month $1.0 $1.1 $1.1 $1.0 $0.9
Blended Capacity and Energy
(based on revenues):
% of planned generation and
capacity sold forward 82% 71% 47% 27% 12%
Average contract
revenue per MWh $42 $46 $50 $55 $46
As of December 31, 2005, approximately 96% of Non-Utility
Nuclear’s counterparty exposure from energy and capacity contracts
is with counterparties with investment grade credit ratings.
Following is a summary of the amount of Energy Commodity
Services’ output and installed capacity that is currently sold forward
under physical or financial contracts at fixed prices:
2006 2007 2008 2009 2010
Capacity:
Planned MW in operation 1,578 1,578 1,578 1,578 1,578
% of capacity sold forward 33% 29% 29% 19% 17%
Energy:
Planned generation (TWh) 4 4 4 4 4
% of planned generation
sold forward 47% 41% 43% 36% 36%
Blended Capacity and Energy
(based on revenues):
% of planned energy and
capacity sold forward 25% 23% 26% 17% 17%
Average contract
revenue per MWh $26 $28 $28 $21 $20
Entergy continually monitors industry trends in order to deter-
mine whether asset impairments or other losses could result from
a decline in value, or cancellation, of merchant power projects,
and records provisions for impairments and losses accordingly.
As discussed in “Results of Operations” above, in 2004 Entergy
determined that the value of the Warren Power plant owned by the
non-nuclear wholesale assets business was impaired, and recorded
the appropriate provision for the loss.
Foreign Currency Exchange Rate Risk
Entergy Gulf States, System Fuels, and Entergy’s Non-Utility
Nuclear business enter into foreign currency forward contracts to
hedge the Euro-denominated payments due under certain purchase
contracts. The notional amounts of the foreign currency forward
contracts are 16.7 million Euro and the forward currency rates
range from .96370 to 1.32540. The maturities of these forward con-
tracts depend on the purchase contract payment dates and range in
time from January 2006 to January 2007. The mark-to-market val-
uation of the forward contracts at December 31, 2005 was a net asset
of $3.5 million. The counterparty banks obligated on these agree-
ments are rated by Standard & Poor’s Rating Services at AA on their
senior debt obligations as of December 31, 2005.
MANAGEMENT’S FINANCIAL DISCUSSION and ANALYSIS continued
The sale of electricity from the power generation
plants owned by Entergy’s Non-Utility Nuclear business
and Energy Commodity Services, unless otherwise contracted,
is subject to the fluctuation of market power prices.
<
>