Entergy 2005 Annual Report Download - page 93
Download and view the complete annual report
Please find page 93 of the 2005 Entergy annual report below. You can navigate through the pages in the report by either clicking on the pages listed below, or by using the keyword search tool below to find specific information within the annual report.-
 1
1 -
2
-
3
-
4
-
5
-
6
-
7
-
8
-
9
-
10
-
11
-
12
-
13
-
14
-
15
-
16
-
17
-
18
-
19
-
20
-
21
-
22
-
23
-
24
-
25
-
26
-
27
-
28
-
29
-
30
-
31
-
32
-
33
-
34
-
35
-
36
-
37
-
38
-
39
-
40
-
41
-
42
-
43
-
44
-
45
-
46
-
47
-
48
-
49
-
50
-
51
-
52
-
53
-
54
-
55
-
56
-
57
-
58
-
59
-
60
-
61
-
62
-
63
-
64
-
65
-
66
-
67
-
68
-
69
-
70
-
71
-
72
-
73
-
74
-
75
-
76
-
77
-
78
-
79
-
80
-
81
-
82
-
 83
83 -
 84
84 -
 85
85 -
 86
86 -
 87
87 -
 88
88 -
 89
89 -
 90
90 -
 91
91 -
 92
92 -
 93
93 -
 94
94 -
 95
95 -
 96
96 -
 97
97 -
 98
98 -
 99
99 -
 100
100 -
 101
101 -
 102
102
 |
 |

ENTERGY CORPORATION AND SUBSIDIARIES 2005
*
89
NOTES to CONSOLIDATED FINANCIAL STATEMENTS continuedNOTES to CONSOLIDATED FINANCIAL STATEMENTS continued
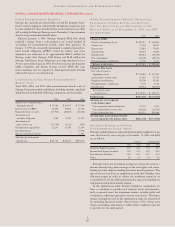
The optimization analysis utilized in Entergy’s latest study
produced the following approved asset class target allocations.
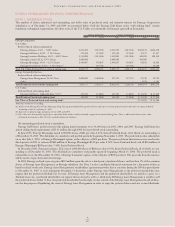
Pension Postretirement
Domestic Equity Securities 45% 37%
International Equity Securities 20% 14%
Fixed–Income Securities 31% 49%
Other (Cash and GACs) 4% 0%
These allocation percentages combined with each asset class’
expected investment return produced an aggregate return expecta-
tion for the five years following the study of 7.6% for pension assets,
5.4% for taxable postretirement assets, and 7.2% for non-taxable
postretirement assets. These returns are not inconsistent with
Entergy’s disclosed expected pre-tax return on assets of 8.50% over
the life of the respective liabilities.
Since precise allocation targets are inefficient to manage security
investments, the following ranges were established to produce an
acceptable economically efficient plan to manage to targets:
Pension Postretirement
Domestic Equity Securities 45% to 55% 32% to 42%
International Equity Securities 15% to 25% 9% to 19%
Fixed–Income Securities 25% to 35% 44% to 54%
Other 0% to 10% 0% to 5%
ACCUMULATED PENSION BENEFIT OBLIGATION
The accumulated benefit obligation for Entergy’s qualified pension
plans was $2.5 billion and $2.3 billion at December 31, 2005 and
2004, respectively.
ESTIMATED FUTURE BENEFIT PAYMENTS
Based upon the assumptions used to measure Entergy’s qualified
pension and postretirement benefit obligation at December 31,
2005, and including pension and postretirement benefits attributable
to estimated future employee service, Entergy expects that benefits
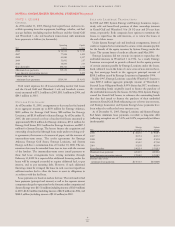
to be paid over the next ten years will be as follows (in thousands):
Estimated Future Benefits Payments Estimated Future Medicare
Year(s) Pension Postretirement Subsidy Receipts
2006 $118,291 $ 58,936 $ 4,241
2007 $120,343 $ 63,280 $ 4,928
2008 $123,592 $ 66,551 $ 5,618
2009 $128,281 $ 69,397 $ 6,249
2010 $134,532 $ 72,545 $ 6,810
2011 – 2015 $840,503 $405,161 $45,328
CONTRIBUTIONS
Entergy expects to contribute $349 million (excluding about $1 million
in employee contributions) to its qualified pension plans in 2006.
$107 million of this contribution was originally planned for 2005,
however it was delayed as a result of the Katrina Emergency Tax
Relief Act. Entergy expects to contribute $60 million to other
postretirement plans in 2006.
ADDITIONAL INFORMATION
The change in the qualified pension plans’ minimum pension liability
included in other comprehensive income and regulatory assets was
as follows for 2005 and 2004 (in thousands):
2005 2004
Increase/(decrease) in the minimum
pension liability included in:
Other comprehensive income (before taxes) $ 13,462 $ (4,578)
Regulatory assets $150,729 $ 73,311
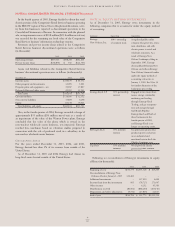
ACTUARIAL ASSUMPTIONS
The assumed health care cost trend rate used in measuring the
APBO of Entergy was 12% for 2006, gradually decreasing each
successive year until it reaches 4.5% in 2012 and beyond. The
assumed health care cost trend rate used in measuring the Net
Other Postretirement Benefit Cost of Entergy was 10% for 2005,
gradually decreasing each successive year until it reaches 4.5% in
2011 and beyond. A one percentage point change in the assumed
health care cost trend rate for 2005 would have the following effects
(in thousands):
1 Percentage Point Increase 1 Percentage Point Decrease
Impact Impact
on the sum of on the sum of
Impact on service costs and Impact on service costs and
the APBO interest cost the APBO interest cost
Entergy
Corporation $101,814 $12,727 $(92,042) $(10,998)
The significant actuarial assumptions used in determining the
pension PBO and the SFAS 106 APBO as of December 31, 2005,
2004, and 2003 were as follows:
2005 2004 2003
Weighted-average discount rate:
Pension 5.90% 6.00% 6.25%
Other postretirement 5.90% 6.00% 6.71%
Weighted-average rate of increase
in future compensation levels 3.25% 3.25% 3.25%
The significant actuarial assumptions used in determining the net
periodic pension and other postretirement benefit costs for 2005,
2004, and 2003 were as follows:
2005 2004 2003
Weighted-average discount rate:
Pension 6.00% 6.25% 6.75%
Other postretirement 6.00% 6.71% 6.75%
Weighted-average rate of increase
in future compensation levels 3.25% 3.25% 3.25%
Expected long-term rate of
return on plan assets:
Taxable assets 5.50% 5.50% 5.50%
Non-taxable assets 8.50% 8.75% 8.75%
Entergy’s remaining pension transition assets are being amortized
over the greater of the remaining service period of active participants
or 15 years which ended in 2005, and its SFAS 106 transition
obligations are being amortized over 20 years ending in 2012.