Boeing 2007 Annual Report Download - page 78
Download and view the complete annual report
Please find page 78 of the 2007 Boeing annual report below. You can navigate through the pages in the report by either clicking on the pages listed below, or by using the keyword search tool below to find specific information within the annual report.-
 1
1 -
2
-
3
-
4
-
5
-
6
-
7
-
8
-
9
-
10
-
11
-
12
-
13
-
14
-
15
-
16
-
17
-
18
-
19
-
20
-
21
-
22
-
23
-
24
-
25
-
26
-
27
-
28
-
29
-
30
-
31
-
32
-
33
-
34
-
35
-
36
-
37
-
38
-
39
-
40
-
41
-
42
-
43
-
44
-
45
-
46
-
47
-
48
-
49
-
50
-
51
-
52
-
53
-
54
-
55
-
56
-
57
-
58
-
59
-
60
-
61
-
62
-
63
-
64
-
65
-
66
-
67
-
 68
68 -
 69
69 -
 70
70 -
 71
71 -
 72
72 -
 73
73 -
 74
74 -
 75
75 -
 76
76 -
 77
77 -
 78
78 -
 79
79 -
 80
80 -
 81
81 -
 82
82 -
 83
83 -
 84
84 -
 85
85 -
 86
86 -
 87
87 -
 88
88 -
89
-
90
-
91
-
92
-
93
-
94
 |
 |

75
Notes to Consolidated Financial Statements
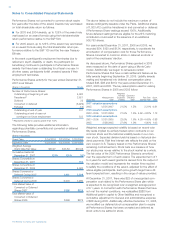
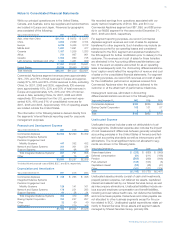
While our principal operations are in the United States,
Canada, and Australia, some key suppliers and subcontractors
are located in Europe and Japan. Revenues by geographic
area consisted of the following:
Years ended December 31, 2007 2006 2005
Asia, other than China $11,104 $÷8,672 $÷5,077
China 2,853 2,659 3,154
Europe 6,296 5,445 3,312
Middle East 1,891 1,991 477
Oceania 1,057 1,206 1,283
Africa 751 967 961
Canada 1,653 660 748
Latin America, Caribbean and other 1,446 1,431 629
27,051 23,031 15,641
United States 39,336 38,499 37,980
Total revenues $66,387 $61,530 $53,621
Commercial Airplanes segment revenues were approximately
79%, 73% and 76% of total revenues in Europe and approxi-
mately 87%, 80% and 80% of total revenues in Asia, excluding
China, for 2007, 2006 and 2005, respectively. IDS revenues
were approximately 16%, 22% and 20% of total revenues in
Europe and approximately 12%, 20% and 19% of total rev-
enues in Asia, excluding China, for 2007, 2006 and 2005
respectively. IDS revenues from the U.S. government repre-
sented 42%, 46% and 51% of consolidated revenues for
2007, 2006 and 2005. Approximately 13% of operating assets
are located outside the United States.
The information in the following tables is derived directly from
the segments’ internal financial reporting used for corporate
management purposes.
Research and Development Expense
Years ended December 31, 2007 2006 2005
Commercial Airplanes $2,962 $2,390 $1,302
Integrated Defense Systems:
Precision Engagement and
Mobility Systems 447 392 432
Network and Space Systems 300 301 334
Support Systems 104 98 89
Total Integrated Defense Systems* 851 791 855
Other 37 76 48
$3,850 $3,257 $2,205
*Includes bid and proposal costs of $306, $227, and $210, respectively.
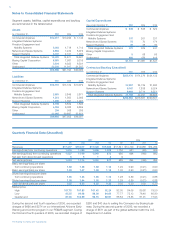
Depreciation and Amortization
Years ended December 31, 2007 2006 2005
Commercial Airplanes $÷«318 $÷«263 $÷«396
Integrated Defense Systems:
Precision Engagement and
Mobility Systems 126 141 161
Network and Space Systems 176 231 283
Support Systems 60 38 24
Total Integrated Defense Systems 362 410 468
Boeing Capital Corporation 222 247 257
Other 32 60 40
Unallocated 551 579 365
$1,485 $1,559 $1,526
We recorded earnings from operations associated with our
equity method investments of $100, $50, and $0 in our
Commercial Airplanes segment and $87, $96, and $88 prima-
rily in our N&SS segment for the years ended December 31,
2007, 2006 and 2005, respectively.
For segment reporting purposes, we record Commercial
Airplanes segment revenues and cost of sales for airplanes
transferred to other segments. Such transfers may include air-
planes accounted for as operating leases and considered
transferred to the BCC segment and airplanes transferred to
the IDS segment for further modification prior to delivery to the
customer. The revenues and cost of sales for these transfers
are eliminated in the Accounting differences/eliminations cap-
tion. In the event an airplane accounted for as an operating
lease is subsequently sold, the ‘Accounting differences/elimina-
tions’ caption would reflect the recognition of revenue and cost
of sales on the consolidated financial statements. For segment
reporting purposes, we record IDS revenues and cost of sales
for the modification performed on airplanes received from
Commercial Airplanes when the airplane is delivered to the
customer or at the attainment of performance milestones.
Intersegment revenues, eliminated in Accounting
differences/eliminations are shown in the following table.
Years ended December 31, 2007 2006 2005
Commercial Airplanes $390 $826 $640
Boeing Capital Corporation 103 131 57
Other 2 5 3
Total $495 $962 $700
Unallocated Expense
Unallocated expense includes costs not attributable to busi-
ness segments. Unallocated expense also includes the impact
of cost measurement differences between generally accepted
accounting principles in the United States of America and fed-
eral cost accounting standards as well as intercompany profit
eliminations. The most significant items not allocated to seg-
ments are shown in the following table.
Years ended December 31, 2007 2006 2005
Share-based plans $«««(233) $«««(680) $«««(999)
Deferred compensation (51) (211) (186)
Pension (561) (369) (846)
Post-retirement (125) (103) (5)
Capitalized interest (53) (48) (47)
Other (162) (322) (324)
Total $(1,185) $(1,733) $(2,407)
Unallocated assets primarily consist of cash and investments,
prepaid pension expense, net deferred tax assets, capitalized
interest and assets held by our Shared Services Group as well
as intercompany eliminations. Unallocated liabilities include var-
ious accrued employee compensation and benefit liabilities,
including accrued retiree health care, net deferred tax liabilities
and income taxes payable. Debentures and notes payable are
not allocated to other business segments except for the por-
tion related to BCC. Unallocated capital expenditures relate pri-
marily to Shared Services Group assets and segment assets
managed by Shared Services Group, primarily IDS.
The Boeing Company and Subsidiaries