Boeing 2007 Annual Report Download - page 23
Download and view the complete annual report
Please find page 23 of the 2007 Boeing annual report below. You can navigate through the pages in the report by either clicking on the pages listed below, or by using the keyword search tool below to find specific information within the annual report.-
 1
1 -
2
-
3
-
4
-
5
-
6
-
7
-
8
-
9
-
10
-
11
-
12
-
 13
13 -
 14
14 -
 15
15 -
 16
16 -
 17
17 -
 18
18 -
 19
19 -
 20
20 -
 21
21 -
 22
22 -
 23
23 -
 24
24 -
 25
25 -
 26
26 -
 27
27 -
 28
28 -
 29
29 -
 30
30 -
 31
31 -
 32
32 -
 33
33 -
34
-
35
-
36
-
37
-
38
-
39
-
40
-
41
-
42
-
43
-
44
-
45
-
46
-
47
-
48
-
49
-
50
-
51
-
52
-
53
-
54
-
55
-
56
-
57
-
58
-
59
-
60
-
61
-
62
-
63
-
64
-
65
-
66
-
67
-
68
-
69
-
70
-
71
-
72
-
73
-
74
-
75
-
76
-
77
-
78
-
79
-
80
-
81
-
82
-
83
-
84
-
85
-
86
-
87
-
88
-
89
-
90
-
91
-
92
-
93
-
94
 |
 |
49.3
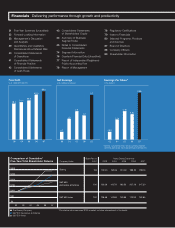
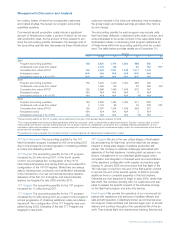
Financials Delivering performance through growth and productivity
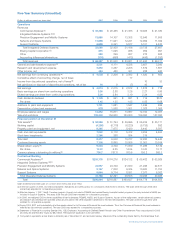
21 Five-Year Summary (Unaudited) 43 Consolidated Statements 78 Regulatory Certifications
22 Forward-Looking Information of Shareholders’ Equity 79 Index to Financials
23 Management’s Discussion
and Analysis
44 Summary of Business
Segment Data 80 Selected Programs, Products
and Services
39
40
Quantitative and Qualitative
Disclosures About Market Risk
Consolidated Statements
45
74
Notes to Consolidated
Financial Statements
Segment Information
87
88
89
Board of Directors
Company Officers
Shareholder Information
of Operations 76 Quarterly Financial Data (Unaudited)
41 Consolidated Statements 77 Report of Independent Registered
of Financial Position Public Accounting Firm
42 Consolidated Statements 78 Report of Management
of Cash Flows
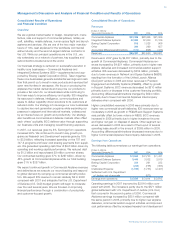
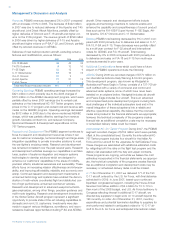
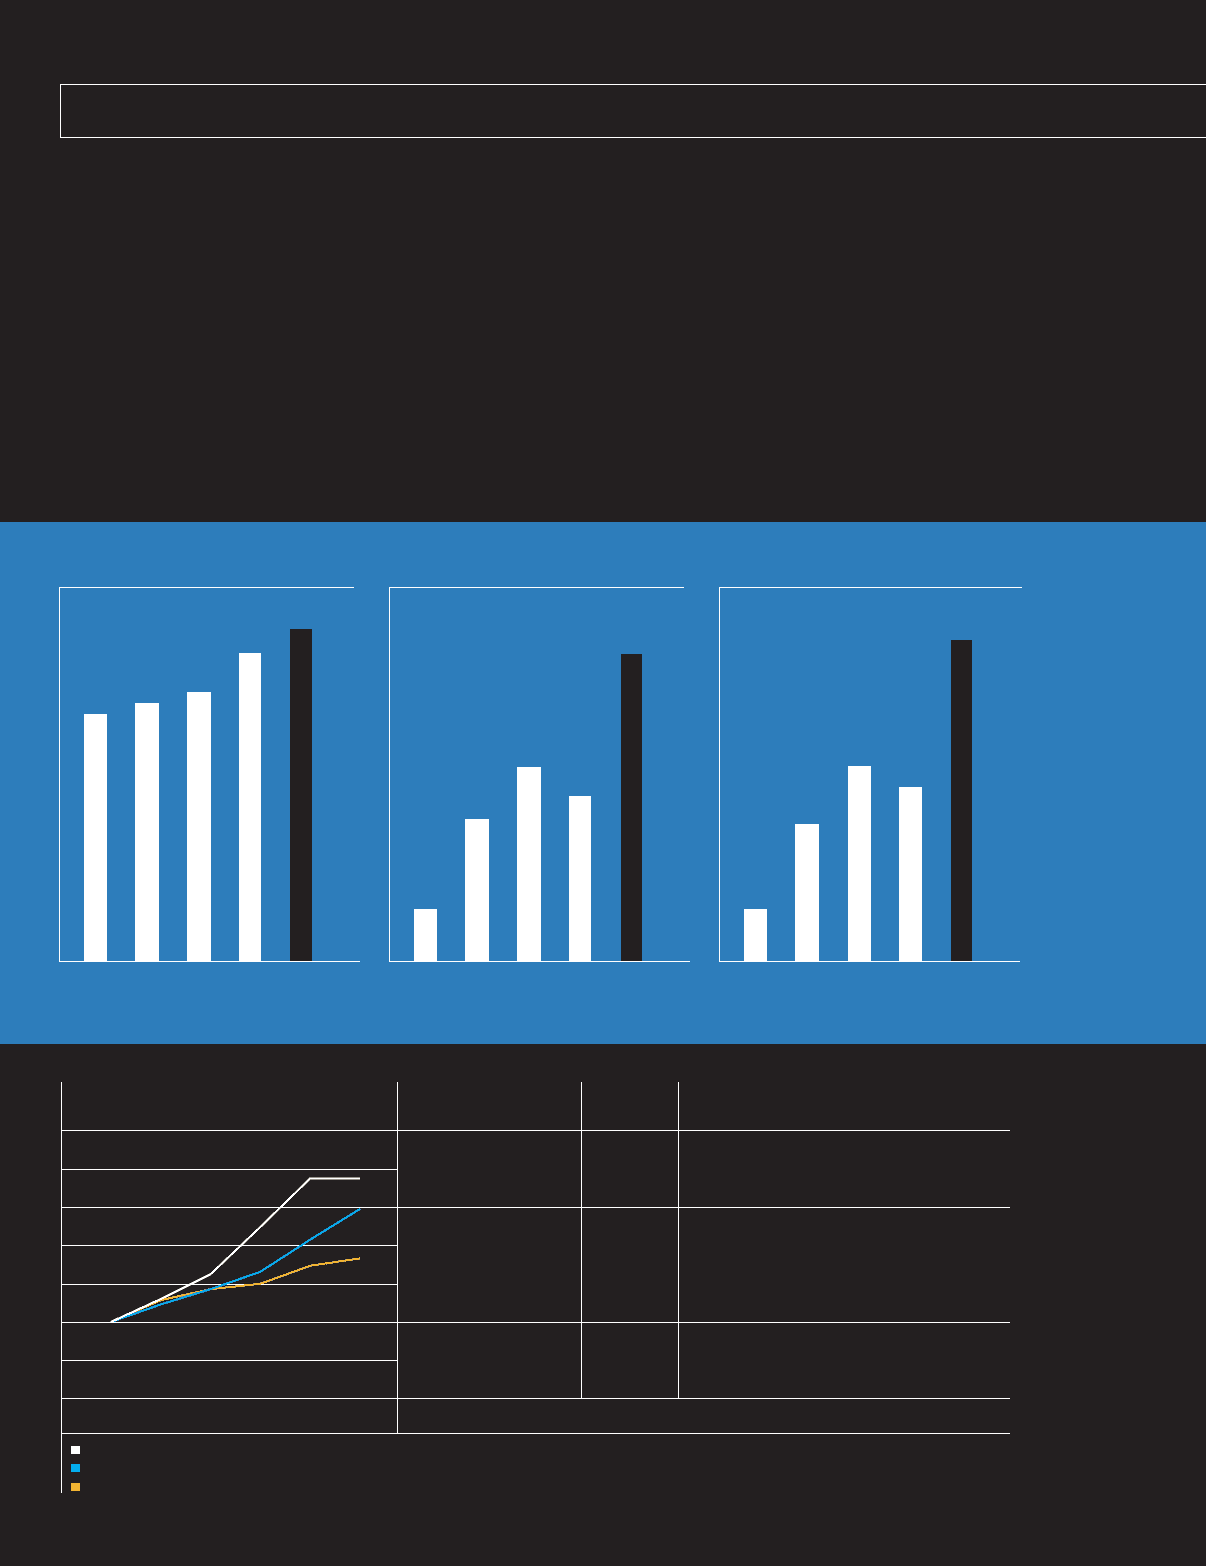
Revenues Net Earnings Earnings Per Share*
U.S. dollars in billions U.S. dollars in billions U.S. dollars
66.4
5.26
61.5 4.1
53.6
51.4
3.19
2.6
2.84
2.2
1.9 2.24
0.85
0.7
03 04 05 06 07 03 04 05 06 07 03 04 05 06 07
*Before cumulative effect of accounting change
and net gain (loss) from discontinued operations
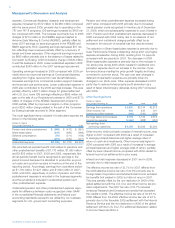
Comparison of Cumulative* Base Period Years Ending December
Five-Year Total Shareholder Returns Company/Index 2002 2003 2004 2005 2006 2007
$300 Boeing 100 130.43 162.86 224.60 288.35 288.04
$250
$200
S&P 500
$150 100 123.09 142.79 165.53 207.18 247.20
Aerospace & Defense
$100
$50 S&P 500 Index 100 128.68 142.68 149.69 173.33 182.85
$0
02 03 04 05 06 07
The Boeing Company *Cumulative return assumes $100 invested; includes reinvestment of dividends
S&P 500 Aerospace & Defense
S&P 500 Index