Boeing 2007 Annual Report Download - page 60
Download and view the complete annual report
Please find page 60 of the 2007 Boeing annual report below. You can navigate through the pages in the report by either clicking on the pages listed below, or by using the keyword search tool below to find specific information within the annual report.-
 1
1 -
2
-
3
-
4
-
5
-
6
-
7
-
8
-
9
-
10
-
11
-
12
-
13
-
14
-
15
-
16
-
17
-
18
-
19
-
20
-
21
-
22
-
23
-
24
-
25
-
26
-
27
-
28
-
29
-
30
-
31
-
32
-
33
-
34
-
35
-
36
-
37
-
38
-
39
-
40
-
41
-
42
-
43
-
44
-
45
-
46
-
47
-
48
-
49
-
 50
50 -
 51
51 -
 52
52 -
 53
53 -
 54
54 -
 55
55 -
 56
56 -
 57
57 -
 58
58 -
 59
59 -
 60
60 -
 61
61 -
 62
62 -
 63
63 -
 64
64 -
 65
65 -
 66
66 -
 67
67 -
 68
68 -
 69
69 -
 70
70 -
71
-
72
-
73
-
74
-
75
-
76
-
77
-
78
-
79
-
80
-
81
-
82
-
83
-
84
-
85
-
86
-
87
-
88
-
89
-
90
-
91
-
92
-
93
-
94
 |
 |

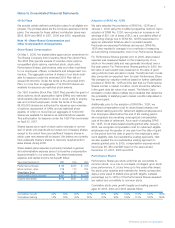
57
Notes to Consolidated Financial Statements
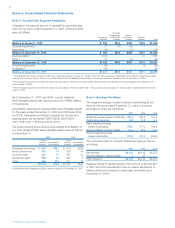
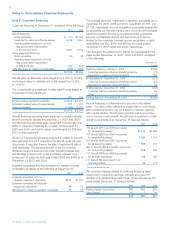
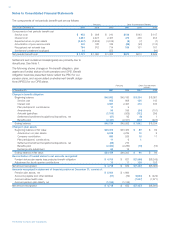
Scheduled payments on customer financing are as follows:
Sales-Type/ Operating
Finance Lease
Principal Lease Equipment
Payments on Payments Payments
Year Notes Receivable Receivable Receivable
2008 $184 $324 $433
2009 95 307 383
2010 104 295 325
2011 156 336 241
2012 111 295 186
Beyond 2012 235 2,257 1,008
Customer financing assets we leased under capital leases and
subleased to others totaled $43 and $137 at December 31,
2007 and 2006.
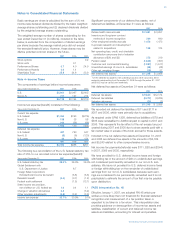
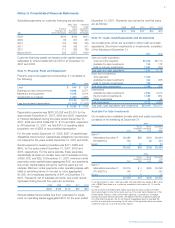
Note 9 – Property, Plant and Equipment
Property, plant and equipment at December 31 consisted of
the following:
2007 2006
Land $÷«÷«544 $÷«÷«524
Buildings and land improvements 8,868 8,571
Machinery and equipment 9,308 8,614
Construction in progress 1,460 1,601
20,180 19,310
Less accumulated depreciation (11,915) (11,635)
$«÷8,265 $«÷7,675
Depreciation expense was $978, $1,058 and $1,001 for the
years ended December 31, 2007, 2006 and 2005, respective-
ly. Interest capitalized during the years ended December 31,
2007, 2006 and 2005 totaled $117, $110 and $84, respective-
ly. At December 31, 2007, we had $314 of operating lease
properties, net of $202 of accumulated depreciation.
For the year ended December 31, 2006, $357 of capital lease
obligations was incurred. Capital lease obligations incurred were
not material for the years ended December 31, 2007 and 2005.
Rental expense for leased properties was $411, $388 and
$400, for the years ended December 31, 2007, 2006 and
2005, respectively. For the same periods, these expenses,
substantially all minimum rentals, were net of sublease income
of $26, $18, and $22. At December 31, 2007, minimum rental
payments under capital leases aggregated $16, and payments
due under capital leases during the next five years are not
material. Minimum rental payments under operating leases with
initial or remaining terms of one year or more aggregated
$1,038, net of sublease payments of $47, at December 31,
2007. Payments, net of sublease amounts, due under operat-
ing leases during the next five years are as follows:
2008 2009 2010 2011 2012
$205 $158 $119 $91 $60
Noncancellable future rentals due from customers for equip-
ment on operating leases aggregated $137 for the year ended
December 31, 2007. Payments due during the next five years
are as follows:
2008 2009 2010 2011 2012
$13 $14 $13 $12 $13
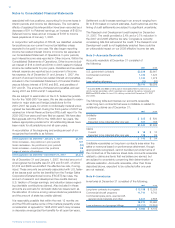
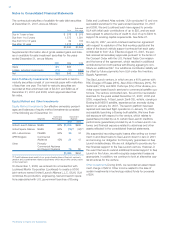
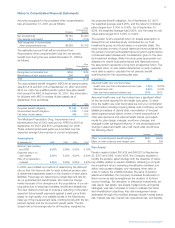
Note 10 – Cash, Cash Equivalents and Investments
Our investments, which are recorded in either Cash and cash
equivalents, Short-term investments or Investments, consisted
of the following at December 31:
2007 2006
Cash and cash equivalents
Cash and time deposits $5,406 $5,710
Available-for-sale investments 134 118
Held-to-maturity investments 1,502 290
Total cash and cash equivalents 7,042 6,118
Short-term investments
Time deposits 1,025
Available-for-sale investments 442 268
Held-to-maturity investments 799
Total short-term investments 2,266 268
Investments
Available-for-sale investments 2,982 3,076
Equity method investments 1,085 964
Other investments 44 45
Total investments 4,111 4,085
Total cash, cash equivalents and investments $13,419 $10,471
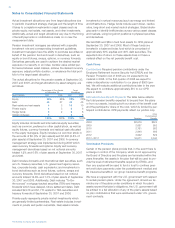
Available-For-Sale Investments
Our investments in available-for-sale debt and equity securities
consisted of the following at December 31:
2007
Cost
Gross Gross
Unrealized Unrealized
Gain Loss
Estimated
Fair
Value
Debt: (1)
Marketable Securities (2)
ETCs/EETCs
Equity
$3,385
145
2
$3,532
$29
10
$39
$(11)
(2)
$(13)
$3,403
143
12
$3,558
2006
Cost
Gross Gross
Unrealized Unrealized
Gain Loss
Estimated
Fair
Value
Debt: (1)
Marketable Securities (2)
ETCs/EETCs
Equity
$3,319
145
4
$3,468
$««4
7
8
$19
$(25)
$(25)
$3,298
152
12
$3,462
(1) At December 31, 2007, debt securities with estimated fair values of $574 and
cost of $580 have been in a continuous unrealized loss position for 12 months
or longer.
(2) The portfolio is diversified and highly liquid and primarily consists of invest-
ment grade fixed income instruments such as U.S. dollar debt obligations of the
United States Treasury, other government agencies, corporations, mortgage-
backed and asset-backed securities. We believe that the unrealized losses are
not other-than-temporary. We do not have a foreseeable need to liquidate the
portfolio and anticipate recovering the full value of the securities either as market
conditions improve, or as the securities mature.
The Boeing Company and Subsidiaries