Boeing 2007 Annual Report Download - page 32
Download and view the complete annual report
Please find page 32 of the 2007 Boeing annual report below. You can navigate through the pages in the report by either clicking on the pages listed below, or by using the keyword search tool below to find specific information within the annual report.-
 1
1 -
2
-
3
-
4
-
5
-
6
-
7
-
8
-
9
-
10
-
11
-
12
-
13
-
14
-
15
-
16
-
17
-
18
-
19
-
20
-
21
-
 22
22 -
 23
23 -
 24
24 -
 25
25 -
 26
26 -
 27
27 -
 28
28 -
 29
29 -
 30
30 -
 31
31 -
 32
32 -
 33
33 -
 34
34 -
 35
35 -
 36
36 -
 37
37 -
 38
38 -
 39
39 -
 40
40 -
 41
41 -
 42
42 -
43
-
44
-
45
-
46
-
47
-
48
-
49
-
50
-
51
-
52
-
53
-
54
-
55
-
56
-
57
-
58
-
59
-
60
-
61
-
62
-
63
-
64
-
65
-
66
-
67
-
68
-
69
-
70
-
71
-
72
-
73
-
74
-
75
-
76
-
77
-
78
-
79
-
80
-
81
-
82
-
83
-
84
-
85
-
86
-
87
-
88
-
89
-
90
-
91
-
92
-
93
-
94
 |
 |

29
Management’s Discussion and Analysis
the $17– $18 billion range in the near future. NASA is continu-
ing to pursue elements of the Vision for Space Exploration,
which will provide additional opportunities.
Commercial Satellite Environment The commercial satellite
market has strengthened since the downturn earlier in the
decade and is expected to stabilize with replacement demand
through the end of the decade. The market remains extremely
competitive with overcapacity across the overall industry and
strong pressure on pricing. We will continue to pursue prof-
itable commercial satellite opportunities where the customer
values our technical expertise and unique solutions.
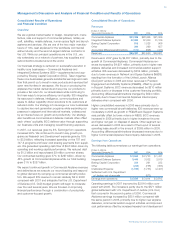
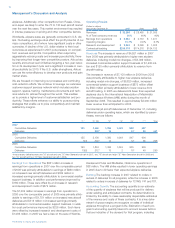
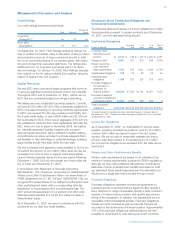
Integrated Defense Systems Operating Results
IDS Realignment Effective January 1, 2007, the B-1 bomber
program (formerly included in PE&MS) and certain Boeing
Australia Limited programs (formerly included in N&SS) are
included in Support Systems. Business segment data for all
periods presented have been adjusted to reflect the realign-
ment. See Note 22.
Operating Results
(Dollars in millions)
Years ended December 31, 2007 2006 2005
Revenues $32,080 $32,439 $31,106
% of Total company revenues 48% 53% 58%
Earnings from operations $««3,440 $««3,032 $««3,919
Operating margins 10.7% 9.3% 12.6%
Research and development $«««««851 $«««««791 $«««««855
Contractual backlog $41,788 $42,291 $36,505
Unobligated backlog $29,922 $33,424 $44,008
Since our operating cycle is long-term and involves many dif-
ferent types of development and production contracts with
varying delivery and milestone schedules, the operating results
of a particular year, or year-to-year comparisons of revenues
and earnings, may not be indicative of future operating results.
In addition, depending on the customer and their funding
sources, our orders might be structured as annual follow-on
contracts, or as one large multi-year order or long-term award.
As a result, period-to-period comparisons of backlog are not
necessarily indicative of future workloads. The following discus-
sions of comparative results among periods should be viewed
in this context.
Revenues IDS revenues decreased 1% in 2007 primarily due
to the exclusion of the government Delta volume from N&SS
revenues, now a revenue component for our joint venture ULA.
Decreased revenue from this exclusion and lower revenues in
the PE&MS segment were partially offset by increased volume
in other N&SS programs and growth in the Support Systems
segment. IDS revenues increased 4% in 2006 as growth in
PE&MS and Support Systems was partially offset by lower vol-
ume in N&SS.
Operating Earnings IDS operating earnings increased by $408
million in 2007 compared with 2006 primarily due to $770 mil-
lion of charges on the AEW&C development program in 2006.
The 2007 increase was partially offset by lower earnings in the
PE&MS and N&SS segments. Operating earnings decreased
by $887 million in 2006 compared with 2005 reflecting a
$569 million net gain on the sale of Rocketdyne in 2005 and
$770 million of charges on the AEW&C development program
in 2006 partially offset by improved margins on other programs.
Backlog Total backlog is comprised of contractual backlog,
which represents work we are on contract to perform for which
we have received funding, and unobligated backlog, which
represents work we are on contract to perform for which fund-
ing has not yet been authorized and appropriated. IDS total
backlog decreased 5% in 2007, from $75,715 million to
$71,710 million, primarily due to current year deliveries and
sales on multi-year contracts awarded in prior years with the
largest decreases in FCS, C-17, and P-8A programs.
For further details on the changes between periods, refer to
the discussions of the individual segments below.
Additional Considerations Our business includes a variety of
development programs which have complex design and tech-
nical challenges. Many of these programs have cost-type con-
tracting arrangements. In these cases the associated financial
risks are primarily in lower profit rates or program cancellation if
milestones and technical progress are not accomplished.
Examples of these programs include Airborne Laser, E/A-18G,
Family of Beyond Line-of-Sight Terminals (JTRS), FCS,
Ground-based Midcourse Defense (GMD), Joint Tactical Radio
System, P-8A and Proprietary programs.
Some of our development programs are contracted on a fixed-
price basis. Many of these programs have highly complex
designs. As technical or quality issues arise, we may experi-
ence schedule delays and cost impacts, which could increase
our estimated cost to perform the work or reduce our estimat-
ed price, either of which could result in a material charge.
These programs are ongoing, and while we believe the cost
and fee estimates incorporated in the financial statements are
appropriate, the technical complexity of these programs cre-
ates financial risk as additional completion costs may become
necessary or scheduled delivery dates could be missed, which
could trigger termination-for-default provisions, the loss of
satellite in-orbit incentive payments, or other financially signifi-
cant exposure. These programs have risk for reach-forward
losses if our estimated costs exceed our estimated contract
revenues. Examples of these programs include AEW&C, inter-
national KC-767 Tanker, commercial and military satellites,
SBInet, Vigilare and High Frequency Modernisation.
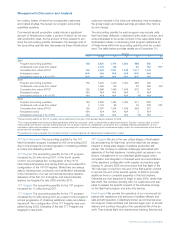
Precision Engagement and Mobility Systems
Operating Results
(Dollars in millions)
Years ended December 31, 2007 2006 2005
Revenues $13,685 $14,107 $13,308
% of Total company revenues 21% 23% 25%
Earnings from operations $««1,629 $««1,208 $««1,720
Operating margins 11.9% 8.6% 12.9%
Research and development $÷÷«447 $÷÷«392 $÷÷«432
Contractual backlog $22,957 $24,739 $21,630
Unobligated backlog $÷8,564 $÷8,962 $15,054
The Boeing Company and Subsidiaries