Boeing 2007 Annual Report Download - page 29
Download and view the complete annual report
Please find page 29 of the 2007 Boeing annual report below. You can navigate through the pages in the report by either clicking on the pages listed below, or by using the keyword search tool below to find specific information within the annual report.-
 1
1 -
2
-
3
-
4
-
5
-
6
-
7
-
8
-
9
-
10
-
11
-
12
-
13
-
14
-
15
-
16
-
17
-
18
-
 19
19 -
 20
20 -
 21
21 -
 22
22 -
 23
23 -
 24
24 -
 25
25 -
 26
26 -
 27
27 -
 28
28 -
 29
29 -
 30
30 -
 31
31 -
 32
32 -
 33
33 -
 34
34 -
 35
35 -
 36
36 -
 37
37 -
 38
38 -
 39
39 -
40
-
41
-
42
-
43
-
44
-
45
-
46
-
47
-
48
-
49
-
50
-
51
-
52
-
53
-
54
-
55
-
56
-
57
-
58
-
59
-
60
-
61
-
62
-
63
-
64
-
65
-
66
-
67
-
68
-
69
-
70
-
71
-
72
-
73
-
74
-
75
-
76
-
77
-
78
-
79
-
80
-
81
-
82
-
83
-
84
-
85
-
86
-
87
-
88
-
89
-
90
-
91
-
92
-
93
-
94
 |
 |

26
Management’s Discussion and Analysis
airplanes. Additionally, other competitors from Russia, China,
and Japan are likely to enter the 70 to 130 seat aircraft market
over the next few years. This market environment has resulted
in intense pressures on pricing and other competitive factors.
Worldwide, airplane sales are generally conducted in U.S. dol-
lars. Fluctuating exchange rates affect the profit potential of our
major competitors, all of whom have significant costs in other
currencies. A decline of the U.S. dollar relative to their local
currencies as experienced in 2007 puts pressure on competi-
tors’ revenues and profits. Competitors often respond by
aggressively reducing costs and increasing productivity, there-
by improving their longer-term competitive posture. Airbus has
recently announced such initiatives targeting a two-year reduc-
tion in its development cycle and a significant increase in over-
all productivity by 2010. If the U.S. dollar strengthens, Airbus
can use the extra efficiency to develop new products and gain
market share.
We are focused on improving our processes and continuing
cost-reduction efforts. We continue to leverage our extensive
customer support services network which includes aviation
support, spares, training, maintenance documents and tech-
nical advice for airlines throughout the world. This enables
us to provide a higher level of customer satisfaction and pro-
ductivity. These efforts enhance our ability to pursue pricing
strategies that enable us to price competitively and maintain
satisfactory margins.
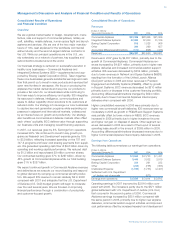
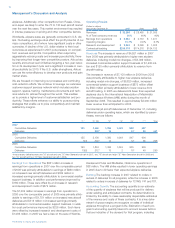
717
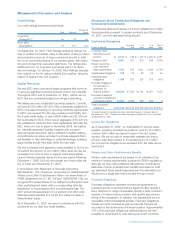
Operating Results
(Dollars in millions)
Years ended December 31, 2007 2006 2005
Revenues $÷33,386 $÷28,465 $÷21,365
% of Total company revenues 50% 46% 40%
Earnings from operations $÷÷3,584 $÷÷2,733 $÷÷1,431
Operating margins 10.7% 9.6% 6.7%
Research and development $÷÷2,962 $÷÷2,390 $÷÷1,302
Contractual backlog $255,176 $174,276 $124,132
Revenues The increase in revenue of $4,921 million in 2007
from 2006 was primarily attributable to higher new airplane
deliveries, including model mix changes, of $3,369 million,
increased commercial aviation support business of $1,432 mil-
lion and $120 million primarily attributable to revenue from
aircraft trading.
The increase in revenue of $7,100 million in 2006 from 2005
was primarily attributable to higher new airplane deliveries,
including model mix changes, of $6,820 million, increased
commercial aviation support business of $873 million offset
by $593 million primarily attributable to lower revenue from
aircraft trading. In 2005 we delivered 29 fewer than expected
airplanes due to the International Association of Machinists
and Aerospace Workers (IAM) strike during the month of
September 2005. This resulted in approximately $2,000 million
lower revenue than anticipated for 2005.
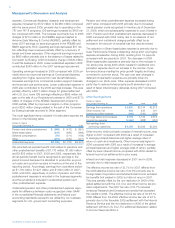
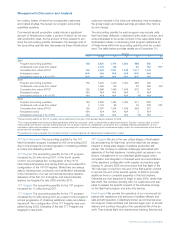
Commercial jet aircraft deliveries as of December 31, including
deliveries under operating lease, which are identified by paren-
theses, were as follows:
737 NG 747 757 767 777 Total
2007
Cumulative Deliveries 155 2,466 1,396 1,049 959 687
Deliveries 330* 16 12* 83 441
2006
Cumulative Deliveries 155 2,136 1,380 1,049 947 604
Deliveries 5(3) 302* 14 12* 65 398
2005
Cumulative Deliveries 150 1,834 1,366 1,049 935 539
Deliveries 13(5) 212* 13 2 10* 40 290
*Intracompany deliveries were one 767 aircraft and one 737 Next Generation aircraft in 2007, two 767 aircraft and eight 737 Next Generation aircraft in 2006 and
two 767 aircraft and two 737 Next Generation aircraft in 2005.
Earnings from Operations The $851 million increase in
earnings from operations in 2007 over the comparable period
of 2006 was primarily attributable to earnings of $950 million
on increased new aircraft deliveries and $304 million in
increased earnings primarily attributable to commercial aviation
support business. In addition cost performance improved by
$169 million. These were offset by an increase in research
and development costs of $572 million.
The $1,302 million increase in earnings from operations in
2006 over the comparable period of 2005 was primarily attrib-
utable to earnings of $1,781 million on increased new aircraft
deliveries and $315 million in increased earnings primarily
attributable to commercial aviation support business. In addi-
tion cost performance improved by $226 million. Such items
were offset by increased research and development costs of
$1,088 million. In 2005 we had a loss on the sale of Wichita,
Kansas and Tulsa and McAlester, Oklahoma operations of
$68 million. The IAM strike resulted in lower operating earnings
in 2005 due to 29 fewer than expected airplane deliveries.
Backlog The backlog increase in 2007 related to orders in
excess of deliveries for all programs, while the increase in 2006
related to orders in excess of deliveries for 737NG, 747 and 787.
Accounting Quantity The accounting quantity is our estimate
of the quantity of airplanes that will be produced for delivery
under existing and anticipated contracts. Its determination is
limited by the ability to make reasonably dependable estimates
of the revenue and costs of these contracts. It is a key deter-
minant of gross margins we recognize on sales of individual
airplanes throughout a program’s life. Estimation of each pro-
gram’s accounting quantity takes into account several factors
that are indicative of the demand for that program, including
The Boeing Company and Subsidiaries