Bank of the West 2014 Annual Report Download - page 8
Download and view the complete annual report
Please find page 8 of the 2014 Bank of the West annual report below. You can navigate through the pages in the report by either clicking on the pages listed below, or by using the keyword search tool below to find specific information within the annual report.-
 1
1 -
 2
2 -
 3
3 -
 4
4 -
 5
5 -
 6
6 -
 7
7 -
 8
8 -
 9
9 -
 10
10 -
 11
11 -
 12
12 -
 13
13 -
 14
14 -
 15
15 -
 16
16 -
 17
17 -
 18
18 -
 19
19 -
20
-
21
-
22
-
23
-
24
-
25
-
26
-
27
-
28
-
29
-
30
-
31
-
32
-
33
-
34
-
35
-
36
-
37
-
38
-
39
-
40
-
41
-
42
-
43
-
44
-
45
-
46
-
47
-
48
-
49
-
50
-
51
-
52
-
53
-
54
-
55
-
56
-
57
-
58
-
59
-
60
-
61
-
62
-
63
-
64
 |
 |

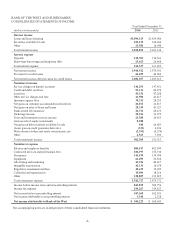
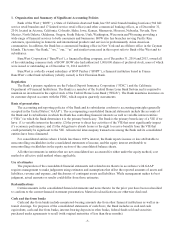
BANK OF THE WEST AND SUBSIDIARIES
CONSOLIDATED STATEMENTS OF CASH FLOWS
Year Ended December 31,
(dollars in thousands) 2014 2013
Cash flows from operating activities
Net income $ 544,222 $ 560,605
Adjustments to reconcile net income to net cash provided by operating activities:
Provision for credit losses 64,455 44,686
Net gains on debt securities available for sale (440) (66,683)
Net gains on sales of loans and leases (28,339) (43,327)
Depreciation, amortization and accretion, net 341,918 260,008
Deferred income taxes 32,225 68,130
Net (increase) decrease in interest receivable and other assets (146,332) 217,903
Net increase (decrease) in interest payable and other liabilities 14,801 (174,787)
Change in fair value of credit guarantee derivative 333 (4,396)
Originations of loans held for sale (435,200) (1,097,834)
Proceeds from sales of loans held for sale 399,525 1,315,926
Other, net (5,121) (30,695)
Net cash provided by operating activities 782,047 1,049,536
Cash flows from investing activities
Securities available for sale:
Proceeds from maturities and prepayments 1,279,050 1,047,996
Proceeds from sales 1,407,878 3,620,122
Purchases (3,173,106) (5,648,085)
Net increase in loans resulting from originations and collections (3,909,399) (2,537,808)
Purchases of loans and leases (80,425) (31,921)
Proceeds from sales (including participations) of loans originated for investment 235,144 71,959
Proceeds from sales of foreclosed assets 22,660 38,314
Purchase of premises, equipment and software (93,362) (102,534)
Net change in low income housing tax credit investments (89,993) (10,369)
Net change in FHLB stock (25,482) 56,562
Proceeds from sales of equity investments 2,911 -
Other, net 12,104 13,087
Net cash used in investing activities (4,412,020) (3,482,677)
Cash flows from financing activities
Net increase in deposits 3,741,316 1,272,000
Net increase in short-term borrowings 2,097,746 2,727,612
Proceeds from issuance of long-term debt 715,483 918,679
Repayment of long-term debt (1,615,365) (1,571,471)
Cash dividends paid (400,000) (300,000)
Net cash provided by financing activities 4,539,180 3,046,820
Net increase in cash and cash equivalents 909,207 613,679
Cash and cash equivalents at beginning of year 3,267,744 2,654,065
Cash and cash equivalents at end of year $ 4,176,951 $ 3,267,744
Supplemental disclosures
Interest paid $ 155,338 $ 166,198
Income taxes paid 379,890 337,821
Noncash investing and financing activities:
Transfer from deposits for the settlement of credit guarantee derivative 587 6,969
Transfers of loans held for investment to loans held for sale 221,550 889
Transfers from loans to other real estate owned 25,765 25,606
The accompanying notes are an integral part of these consolidated financial statements.
-6-