Bank of the West 2014 Annual Report Download - page 24
Download and view the complete annual report
Please find page 24 of the 2014 Bank of the West annual report below. You can navigate through the pages in the report by either clicking on the pages listed below, or by using the keyword search tool below to find specific information within the annual report.-
 1
1 -
2
-
3
-
4
-
5
-
6
-
7
-
8
-
9
-
10
-
11
-
12
-
13
-
 14
14 -
 15
15 -
 16
16 -
 17
17 -
 18
18 -
 19
19 -
 20
20 -
 21
21 -
 22
22 -
 23
23 -
 24
24 -
 25
25 -
 26
26 -
 27
27 -
 28
28 -
 29
29 -
 30
30 -
 31
31 -
 32
32 -
 33
33 -
 34
34 -
35
-
36
-
37
-
38
-
39
-
40
-
41
-
42
-
43
-
44
-
45
-
46
-
47
-
48
-
49
-
50
-
51
-
52
-
53
-
54
-
55
-
56
-
57
-
58
-
59
-
60
-
61
-
62
-
63
-
64
 |
 |

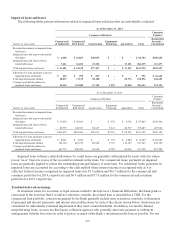
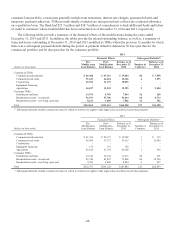
The quantitative assumptions used in determining the lower of cost or fair value of the Bank’s MSRs were as follows:
2014 2013
Range Weighted-Average Range Weighted-Average
Conditional prepayment rate 5.80% – 12.17% 9.62% 4.60% – 17.65% 10.83%
Life in years (of the MSR) 3.72 – 10.14 7.19 2.84 – 11.08 6.09
Weighted-average coupon rate 2.88% – 4.78% 4.11% 2.61% – 5.38% 3.84%
Discount rate 9.50% – 9.91% 9.50% 9.50% – 12.50% 10.10%
In addition to loans originated for sale and certain loans which we no longer intend to hold to maturity, the Bank
sells participating interests in certain commercial loans to other financial institutions. The Bank continues to maintain
the servicing relationship with borrowers for the entire loan and receives a nominal fee from these borrowers to cover
the costs of servicing activities. As of December 31, 2014 and 2013, the Bank recognized $334.3 million and $361.2
million (net of charge-offs), respectively, as its retained interest in the unpaid principal balance of the loans. The unpaid
principal balance of loans sold as participating interests as of December 31, 2014 and 2013 was $319.7 million and
$335.6 million, respectively. As the Bank sold the participating interests concurrently with the loan origination, there
was no difference between the fair value and carrying amount of the loans transferred and therefore no gain or loss on
sale was recognized for the years ended December 31, 2014 and 2013.
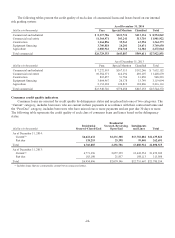
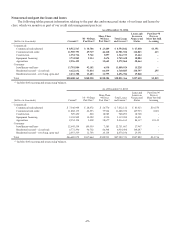
4. Loans and Leases
The following table presents the outstanding balances for loans and leases by portfolio segment:
As of December 31,
(dollars in thousands) 2014 2013
Commercial:
Commercial and industrial $ 8,554,842 $ 7,632,152
Commercial real estate 11,981,922 11,428,670
Construction 1,364,373 948,293
Equipment financing 3,749,650 3,119,094
Agriculture 2,272,064 2,416,163
Consumer:
Installments and lines 13,880,924 12,751,667
Residential secured–closed-end 6,760,885 6,954,496
Residential secured–revolving, open-end 2,256,706 2,079,196
Total loans and leases $50,821,366 $47,329,731
Outstanding balances as of December 31, 2014 and 2013 are net of unearned income, including net deferred loan
fees, of $226.0 million and $188.5 million, respectively.
Loans totaling $34,311.7 million and $29,372.1 million were pledged to collateralize the Bank’s borrowing
capacity at the FRB and FHLB as of December 31, 2014 and 2013, respectively. Additionally, $671.5 million from the
consumer installment and lines portfolio were pledged as collateral for the securitization of automobile loans as of
December 31, 2014. See Note 8 for additional information.
A significant portion of our loan and lease portfolio is located in California. No other states have a significant
portion of our portfolio. The risk inherent in our loan and lease portfolio is dependent upon the economic stability of this
state, which affects property values, and the financial well-being and creditworthiness of the borrowers.
Our leasing activities consist primarily of leasing commercial equipment and automobiles. Generally, lessees are
responsible for all maintenance, taxes and insurance on the leased property.
-22-