Bank of the West 2014 Annual Report Download - page 19
Download and view the complete annual report
Please find page 19 of the 2014 Bank of the West annual report below. You can navigate through the pages in the report by either clicking on the pages listed below, or by using the keyword search tool below to find specific information within the annual report.-
 1
1 -
2
-
3
-
4
-
5
-
6
-
7
-
8
-
 9
9 -
 10
10 -
 11
11 -
 12
12 -
 13
13 -
 14
14 -
 15
15 -
 16
16 -
 17
17 -
 18
18 -
 19
19 -
 20
20 -
 21
21 -
 22
22 -
 23
23 -
 24
24 -
 25
25 -
 26
26 -
 27
27 -
 28
28 -
 29
29 -
30
-
31
-
32
-
33
-
34
-
35
-
36
-
37
-
38
-
39
-
40
-
41
-
42
-
43
-
44
-
45
-
46
-
47
-
48
-
49
-
50
-
51
-
52
-
53
-
54
-
55
-
56
-
57
-
58
-
59
-
60
-
61
-
62
-
63
-
64
 |
 |

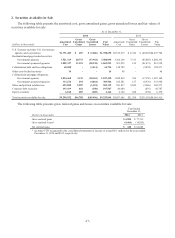
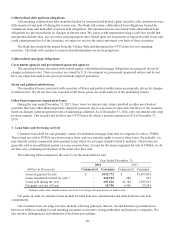
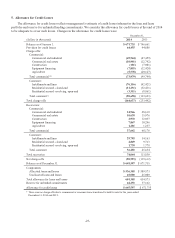
2. Securities Available for Sale
The following table presents the amortized cost, gross unrealized gains, gross unrealized losses and fair values of
securities available for sale:
As of December 31,
2014 2013
(dollars in thousands)
Amortized
Cost
Gross
Unrealized
Gains
Gross
Unrealized
Losses
Fair
Value
Amortized
Cost
Gross
Unrealized
Gains
Gross
Unrealized
Losses
Fair
Value
U.S. Treasury and other U.S. Government
agencies and corporations $1,791,489 $ 607 $ (3,406) $1,788,690 $2,515,319 $ 2,434 $ (20,045)$2,497,708
Residential mortgage-backed securities:
Government agencies 3,521,329 20,733 (37,964) 3,504,098 3,366,169 7,915 (85,889) 3,288,195
Government sponsored agencies 1,882,327 11,325 (28,130) 1,865,522 901,253 150 (81,471) 819,932
Collateralized debt and loan obligations 68,208 - (3,414) 64,794 138,723 - (9,852) 128,871
Other asset-backed securities 14 - - 14 48 - - 48
Collateralized mortgage obligations:
Government agencies 1,024,460 3,335 (10,365) 1,017,430 1,042,812 306 (17,950) 1,025,168
Government sponsored agencies 313,276 294 (4,064) 309,506 362,281 137 (8,476) 353,942
States and political subdivisions 493,850 9,587 (1,318) 502,119 521,837 9,824 (9,086) 522,575
Corporate debt securities 197,439 418 (350) 197,507 43,084 - (297) 42,787
Equity securities 6,160 489 (485) 6,164 6,160 622 (592) 6,190
Total securities available for sale $9,298,552 $46,788 $(89,496) $9,255,844 $8,897,686 $21,388 $(233,658)$8,685,416
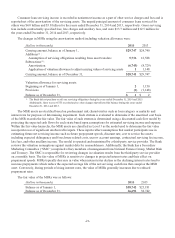
The following table presents gross realized gains and losses on securities available for sale:
Year Ended
December 31,
(dollars in thousands) 2014 2013
Gross realized gains $ 4,904 $ 77,519
Gross realized losses(1) (4,464) (10,836)
Net realized gains $ 440 $ 66,683
(1) Includes OTTI recognized in the consolidated statements of income of nil and $0.1 million for the years ended
December 31, 2014 and 2013, respectively.
-17-