Bank of the West 2014 Annual Report Download - page 20
Download and view the complete annual report
Please find page 20 of the 2014 Bank of the West annual report below. You can navigate through the pages in the report by either clicking on the pages listed below, or by using the keyword search tool below to find specific information within the annual report.-
 1
1 -
2
-
3
-
4
-
5
-
6
-
7
-
8
-
9
-
 10
10 -
 11
11 -
 12
12 -
 13
13 -
 14
14 -
 15
15 -
 16
16 -
 17
17 -
 18
18 -
 19
19 -
 20
20 -
 21
21 -
 22
22 -
 23
23 -
 24
24 -
 25
25 -
 26
26 -
 27
27 -
 28
28 -
 29
29 -
 30
30 -
31
-
32
-
33
-
34
-
35
-
36
-
37
-
38
-
39
-
40
-
41
-
42
-
43
-
44
-
45
-
46
-
47
-
48
-
49
-
50
-
51
-
52
-
53
-
54
-
55
-
56
-
57
-
58
-
59
-
60
-
61
-
62
-
63
-
64
 |
 |

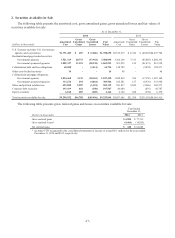
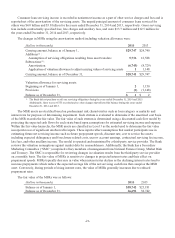
The fair value and amortized cost of debt securities available for sale as of December 31, 2014, by contractual
maturity, are shown below. Actual maturities may differ from contractual maturities because borrowers may have the
right to call or prepay obligations with or without prepayment penalties.
Remaining Contractual Principal Maturity
Within 1
Year
After 1 But
Within 5
Years
After 5
Years But
Within
10 Years After 10 Years Total
Amount(dollars in thousands) Amount Amount Amount Amount
U.S. Treasury and other U.S. Government
agencies and corporations $181,261 $1,607,348 $ 8 $ 73 $1,788,690
Residential mortgage-backed securities:
Government agencies - - - 3,504,098 3,504,098
Government sponsored agencies - 3,458 - 1,862,064 1,865,522
Collateralized debt and loan obligations - 8,586 56,208 - 64,794
Other asset-backed securities -131 - 14
Collateralized mortgage obligations:
Government agencies - - - 1,017,430 1,017,430
Government sponsored agencies - - - 309,506 309,506
States and political subdivisions 31,739 99,301 114,459 256,620 502,119
Corporate debt securities 2,238 195,269 - - 197,507
Estimated fair value of debt securities $215,238 $1,913,975 $170,676 $6,949,791 $9,249,680
Total amortized cost of debt securities $214,944 $1,916,133 $171,615 $6,989,700 $9,292,392
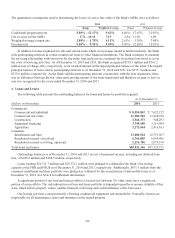
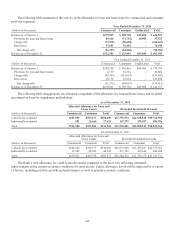
Securities with an aggregate carrying value of $5.5 billion and $5.8 billion were pledged to secure public deposits,
repurchase agreements, borrowings from the Federal Reserve Bank (“FRB”), derivative liability positions and for other
purposes as of December 31, 2014 and 2013, respectively. As of December 31, 2014 and 2013, there were no secured
parties that had the right to repledge or resell these securities.
We held no securities of any single issuer (other than the U.S. Government and government sponsored agencies)
which were in excess of 10% of consolidated stockholder’s equity as of December 31, 2014 and 2013.
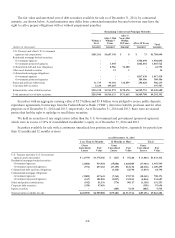
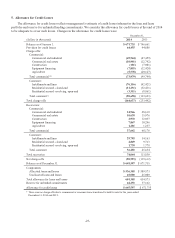
Securities available for sale with a continuous unrealized loss position are shown below, separately for periods less
than 12 months and 12 months or more:
As of December 31, 2014
Less Than 12 Months 12 Months or More Total
Gross
Unrealized
Losses
Fair
Value
Gross
Unrealized
Losses
Fair
Value
Gross
Unrealized
Losses
Fair
Value
U.S. Treasury and other U.S. Government
agencies and corporations $ (2,979) $1,378,186 $ (427) $ 55,246 $ (3,406) $1,433,432
Residential mortgage-backed securities:
Government agencies (2,084) 535,510 (35,880) 1,420,085 (37,964) 1,955,595
Government sponsored agencies (971) 297,103 (27,159) 812,196 (28,130) 1,109,299
Collateralized debt and loan obligations - - (3,414) 64,794 (3,414) 64,794
Collateralized mortgage obligations:
Government agencies (3,002) 417,641 (7,363) 372,732 (10,365) 790,373
Government sponsored agencies (167) 101,856 (3,897) 132,831 (4,064) 234,687
States and political subdivisions (542) 81,136 (776) 50,117 (1,318) 131,253
Corporate debt securities (350) 97,656 - - (350) 97,656
Equity securities - - (485) 5,515 (485) 5,515
Total securities available for sale $(10,095) $2,909,088 $(79,401) $2,913,516 $(89,496) $5,822,604
-18-