Bank of the West 2014 Annual Report Download - page 45
Download and view the complete annual report
Please find page 45 of the 2014 Bank of the West annual report below. You can navigate through the pages in the report by either clicking on the pages listed below, or by using the keyword search tool below to find specific information within the annual report.-
 1
1 -
2
-
3
-
4
-
5
-
6
-
7
-
8
-
9
-
10
-
11
-
12
-
13
-
14
-
15
-
16
-
17
-
18
-
19
-
20
-
21
-
22
-
23
-
24
-
25
-
26
-
27
-
28
-
29
-
30
-
31
-
32
-
33
-
34
-
 35
35 -
 36
36 -
 37
37 -
 38
38 -
 39
39 -
 40
40 -
 41
41 -
 42
42 -
 43
43 -
 44
44 -
 45
45 -
 46
46 -
 47
47 -
 48
48 -
 49
49 -
 50
50 -
 51
51 -
 52
52 -
 53
53 -
 54
54 -
 55
55 -
56
-
57
-
58
-
59
-
60
-
61
-
62
-
63
-
64
 |
 |

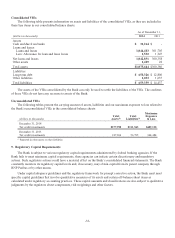
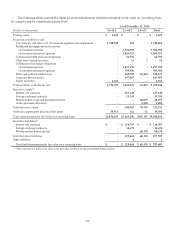
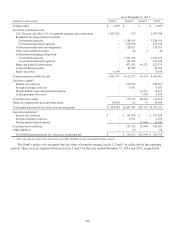
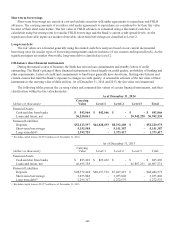
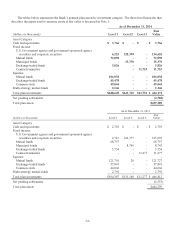
The changes for 2014 in Level 3 assets and liabilities measured at fair value on a recurring basis are summarized in
the table below. Net unrealized gains of $23.4 million were included in net income for the year relating to assets held as
of December 31, 2014. Net unrealized losses of $23.4 million were included in net income for the year relating to
liabilities held as of December 31, 2014.
(dollars in thousands)
Balance
of asset
(liability)
as of
January 1,
2014
Total net
gains
(losses)
included in
net income(1)
Total net
gains
(losses)
included
in OCI(2)
Purchases/
Issuances Sales Settlements
Transfers
into
Level 3
Transfers
out of
Level 3
Balance of
asset
(liability)
as of
December 31,
2014
Securities available for sale:
Other asset-backed securities $2$-$-$-$-$(1)$-$-$1
States and political subdivisions 49,372 - 3,778 1,408 - (18,144) - - 36,414
Total securities available for sale $ 49,374 $ - $3,778 $ 1,408 $ - $(18,145) $ - $ - $ 36,415
Market-linked swaps and purchased options 36,833 23,959 - 23,595 (3,355) (12,953) - - 68,079
Credit guarantee derivative 3,570 (333) - - - (587) - - 2,650
Deferred compensation plan and other
assets 19 - - - - (8) - - 11
Total assets $ 89,796 $ 23,626 $3,778 $ 25,003 $(3,355) $(31,693) $ - $ - $107,155
Written market-linked options $(36,944) $(23,959) $ - $(23,595) $ 3,363 $ 12,997 $ - $ - $ (68,138)
Total liabilities $(36,944) $(23,959) $ - $(23,595) $ 3,363 $ 12,997 $ - $ - $ (68,138)
(1) Included in noninterest income in the consolidated statements of income.
(2) Included in net change in unrealized gains on securities available for sale in the consolidated statements of comprehensive income.
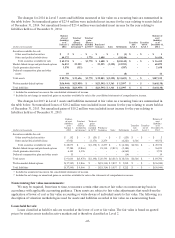
The changes for 2013 in Level 3 assets and liabilities measured at fair value on a recurring basis are summarized in
the table below. Net unrealized losses of $10.2 million were included in net income for the year relating to assets held as
of December 31, 2013. Net unrealized gains of $10.2 million were included in net income for the year relating to
liabilities held as of December 31, 2013.
(dollars in thousands)
Balance
of asset
(liability)
as of
January 1,
2013
Total net
gains
(losses)
included in
net income(1)
Total net
gains
(losses)
included
in OCI(2)
Purchases/
Issuances Sales Settlements
Transfers
into
Level 3
Transfers
out of
Level 3
Balance of
asset
(liability)
as of
December 31,
2013
Securities available for sale:
Other asset-backed securities $ 152 $ - $ (25) $ - $ - $ (125) $ - $ - $ 2
States and political subdivisions 47,921 - (1,173) 2,279 - (6,221) 6,566 - 49,372
Total securities available for sale $ 48,073 $ - $(1,198) $ 2,279 $ - $ (6,346) $6,566 $ - $ 49,374
Market-linked swaps and purchased options 37,384 (9,866) - 18,314 (3,815) (5,184) - - 36,833
Credit guarantee derivative 6,143 4,396 - - - (6,969) - - 3,570
Deferred compensation plan and other assets 33 - - - - (14) - - 19
Total assets $ 91,633 $(5,470) $(1,198) $ 20,593 $(3,815) $(18,513) $6,566 $ - $ 89,796
Written market-linked options $(37,545) $ 9,866 $ - $(18,314) $ 3,837 $ 5,212 $ - $ - $(36,944)
Total liabilities $(37,545) $ 9,866 $ - $(18,314) $ 3,837 $ 5,212 $ - $ - $(36,944)
(1) Included in noninterest income in the consolidated statements of income.
(2) Included in net change in unrealized gains on securities available for sale in the statements of comprehensive income.
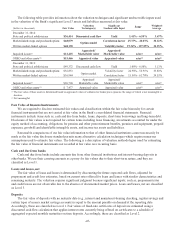
Nonrecurring fair value measurements:
We may be required, from time to time, to measure certain other assets at fair value on a nonrecurring basis in
accordance with applicable accounting guidance. These assets are subject to fair value adjustments that result from the
application of lower of cost or fair value accounting or write-downs of individual assets to fair value. The following is a
description of valuation methodologies used for assets and liabilities recorded at fair value on a nonrecurring basis.
Loans held for sale
Loans classified as held for sale are recorded at the lower of cost or fair value. The fair value is based on quoted
prices for similar assets traded in active markets and is therefore classified as Level 2.
-43-