Bank of the West 2014 Annual Report Download - page 23
Download and view the complete annual report
Please find page 23 of the 2014 Bank of the West annual report below. You can navigate through the pages in the report by either clicking on the pages listed below, or by using the keyword search tool below to find specific information within the annual report.-
 1
1 -
2
-
3
-
4
-
5
-
6
-
7
-
8
-
9
-
10
-
11
-
12
-
 13
13 -
 14
14 -
 15
15 -
 16
16 -
 17
17 -
 18
18 -
 19
19 -
 20
20 -
 21
21 -
 22
22 -
 23
23 -
 24
24 -
 25
25 -
 26
26 -
 27
27 -
 28
28 -
 29
29 -
 30
30 -
 31
31 -
 32
32 -
 33
33 -
34
-
35
-
36
-
37
-
38
-
39
-
40
-
41
-
42
-
43
-
44
-
45
-
46
-
47
-
48
-
49
-
50
-
51
-
52
-
53
-
54
-
55
-
56
-
57
-
58
-
59
-
60
-
61
-
62
-
63
-
64
 |
 |
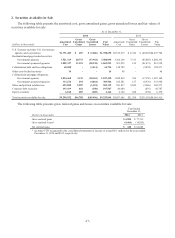
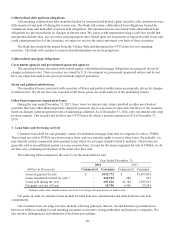
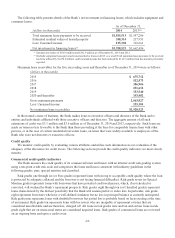
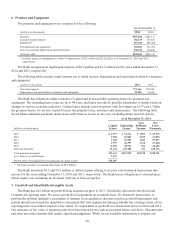
Consumer loan servicing income is recorded in noninterest income as a part of other service charges and fees and is
reported net of the amortization of the servicing assets. The unpaid principal amount of consumer loans serviced for
others was $4.0 billion and $3.8 billion for the years ended December 31, 2014 and 2013, respectively. Gross servicing
fees include contractually specified fees, late charges and ancillary fees, and were $13.7 million and $12.5 million for
the years ended December 31, 2014 and 2013, respectively.
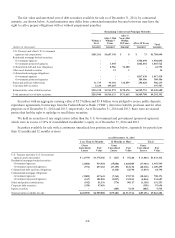
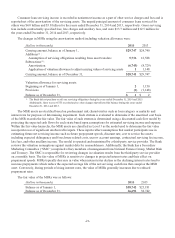
The changes in MSRs using the amortization method including valuation allowance were:
(dollars in thousands) 2014 2013
Carrying amount, balance as of January 1, $29,747 $24,740
Additions(1) :
Assumption of servicing obligations resulting from asset transfers 5,736 12,588
Subtractions(1) :
Amortization (6,743) (8,729)
Application of valuation allowance to adjust carrying values of servicing assets 11,148
Carrying amount, balance as of December 31, $28,741 $29,747
Valuation allowance for servicing assets:
Beginning as of January 1, 21,150
Provisions (1) (1,148)
Balance as of December 31, $1$2
(1) The Bank did not purchase or sell any servicing obligations during the years ended December 31, 2014 and 2013.
Additionally, there was no OTTI recorded and no other changes that affected the balance during the years ended
December 31, 2014 and 2013.
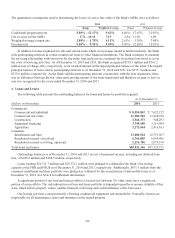
The MSR assets are stratified based on predominant risk characteristics such as loan category or maturity and
interest rate for purposes of determining impairment. Each stratum is evaluated to determine if the amortized cost basis
of the MSR exceeds the fair value. The fair value of each stratum is determined using a discounted cash flow model by
projecting the expected cash flows for each strata based upon assumptions for estimated servicing income and expense.
Within the fair value hierarchy, the MSR assets are classified as Level 3 as the model used to determine the fair value
incorporates use of significant unobservable inputs. These inputs reflect assumptions that market participants use in
estimating future net servicing income such as future prepayment speeds, discount rate, cost to service the assets
including expected delinquency and foreclosure related costs, escrow account earnings, contractual servicing fee income,
late fees, and other ancillary income. The model is operated and maintained by a third-party service provider. The Bank
reviews the valuation assumptions against market data for reasonableness. Additionally, the Bank has a Secondary
Marketing Committee (“SMC”) comprised of key members of management from National Finance Group, Market Risk
and Treasury. The SMC is responsible for reviewing changes in valuation results from the third-party service provider
on a monthly basis. The fair value of MSRs is sensitive to changes in projected interest rates and their effect on
prepayment speeds. MSRs typically decrease in value when interest rates decline as the declining interest rates tend to
increase prepayments which reduce the expected average life of the net servicing cash flows that comprise the MSR
asset. Conversely, during periods of rising interest rates, the value of MSRs generally increases due to reduced
prepayment rates.
The fair value of the MSRs was as follows:
(dollars in thousands) 2014 2013
Balance as of January 1, $38,742 $25,181
Balance as of December 31, 36,694 38,742
-21-