Albertsons 2005 Annual Report Download - page 9
Download and view the complete annual report
Please find page 9 of the 2005 Albertsons annual report below. You can navigate through the pages in the report by either clicking on the pages listed below, or by using the keyword search tool below to find specific information within the annual report.-
 1
1 -
 2
2 -
 3
3 -
 4
4 -
 5
5 -
 6
6 -
 7
7 -
 8
8 -
 9
9 -
 10
10 -
 11
11 -
 12
12 -
 13
13 -
 14
14 -
 15
15 -
 16
16 -
 17
17 -
 18
18 -
 19
19 -
 20
20 -
21
-
22
-
23
-
24
-
25
-
26
-
27
-
28
-
29
-
30
-
31
-
32
-
33
-
34
-
35
-
36
-
37
-
38
-
39
-
40
-
41
-
42
-
43
-
44
-
45
-
46
-
47
-
48
-
49
-
50
-
51
-
52
-
53
-
54
-
55
-
56
-
57
-
58
-
59
-
60
-
61
-
62
-
63
-
64
-
65
-
66
-
67
-
68
-
69
-
70
-
71
-
72
-
73
-
74
-
75
-
76
-
77
-
78
-
79
-
80
-
81
-
82
-
83
-
84
-
85
-
86
-
87
-
88
 |
 |
superstores and regional supermarkets. The retail operations include results of food stores owned and results of
sales to extreme value stores licensed by the company. Food distribution operations include results of sales to
affiliated food stores, mass merchants and other customers, and the results of other third party logistics
arrangements. Management utilizes more than one measurement and multiple views of data to assess segment
performance and to allocate resources to the segments. However, the dominant measurements are consistent with
the consolidated financial statements. The financial information concerning the company’s operations by
reportable segment for the years ended February 26, 2005, February 28, 2004 and February 22, 2003 is contained
on page F-7.
Retail Food Operations
Overview. At February 26, 2005, the company conducted its retail food operations through a total of
1,549 retail stores, including 879 licensed extreme value stores. Its principal retail food formats include extreme
value stores, regional price superstores and regional supermarkets. These diverse formats enable the company to
operate in a variety of markets under widely differing competitive circumstances. Based on revenues, the
company was the eighth largest grocery retailer in the United States as of February 26, 2005. In fiscal 2006, the
company anticipates opening approximately 90 to 110 new extreme value stores, including licensed sites, and 10
to 12 regional banner stores and continuing its store remodeling program.
Extreme Value Stores. The company operates extreme value stores primarily under the Save-A-Lot
banner. Save-A-Lot holds the number one market position, based on revenues, in the extreme value grocery-
retailing sector. Save-A-Lot food stores typically are approximately 15,000 square feet in size, and stock
approximately 1,250 high volume food items generally in a single size for each product sold, as well as a limited
offering of general merchandise items. At a Save-A-Lot store, the majority of the food products offered for sale
are custom branded products. The specifications for the Save-A-Lot custom branded product emphasize quality
and characteristics that the company believes are comparable to national brands. The company’s attention to the
packaging of Save-A-Lot products has resulted in the company registering a number of its custom labels.
At fiscal year end, there were 1,287 extreme value stores, including 466 combination food and general
merchandise stores, located in 39 states of which 879 were licensed. These stores are supplied from 16 dedicated
distribution centers.
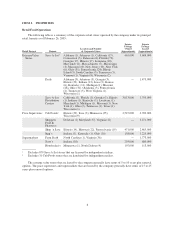
Price Superstores. The company’s price superstores hold the number one, two or three market position in
most of their markets. The price superstore focus is on providing every day low prices and product selection
across all departments. Most of the company’s price superstores offer traditional dry grocery departments, along
with strong perishable departments and pharmacies. Price superstores carry over 45,000 items and generally
range in size from 45,000 to 100,000 square feet with an average size of approximately 64,000 square feet.
At fiscal year end, the company owned and operated 202 price superstores under the Cub Foods, Shop ’n
Save, Shoppers Food & Pharmacy and bigg’s banners in 12 states; an additional 31 stores were franchised to
independent retailers under the Cub Foods banner. In-store pharmacies are operated in 183 of the price
superstores.
The owned Cub Food stores operate primarily in the Minneapolis/St. Paul and Chicago markets; Shop ’n
Save operates primarily in the St. Louis and Pittsburgh markets; Shoppers Food & Pharmacy operates in the
Washington D.C. and Baltimore markets; and bigg’s operates primarily in the Cincinnati market.
Supermarkets. The company’s traditional supermarkets hold leading market positions in their principal
markets. This format combines a grocery store that offers traditional dry grocery and fresh food departments, and
a variety of specialty departments that may include floral, seafood, expanded health and beauty care, video rental,
cosmetics, delicatessen, bakery, photo finishing, liquor, as well as an in-store bank and a traditional drug store
that includes a pharmacy. A typical supermarket carries approximately 32,000 items and generally ranges in size
from 30,000 to 65,000 square feet with an average size of approximately 50,000 square feet.
3