Albertsons 2005 Annual Report Download - page 57
Download and view the complete annual report
Please find page 57 of the 2005 Albertsons annual report below. You can navigate through the pages in the report by either clicking on the pages listed below, or by using the keyword search tool below to find specific information within the annual report.-
 1
1 -
2
-
3
-
4
-
5
-
6
-
7
-
8
-
9
-
10
-
11
-
12
-
13
-
14
-
15
-
16
-
17
-
18
-
19
-
20
-
21
-
22
-
23
-
24
-
25
-
26
-
27
-
28
-
29
-
30
-
31
-
32
-
33
-
34
-
35
-
36
-
37
-
38
-
39
-
40
-
41
-
42
-
43
-
44
-
45
-
46
-
 47
47 -
 48
48 -
 49
49 -
 50
50 -
 51
51 -
 52
52 -
 53
53 -
 54
54 -
 55
55 -
 56
56 -
 57
57 -
 58
58 -
 59
59 -
 60
60 -
 61
61 -
 62
62 -
 63
63 -
 64
64 -
 65
65 -
 66
66 -
 67
67 -
68
-
69
-
70
-
71
-
72
-
73
-
74
-
75
-
76
-
77
-
78
-
79
-
80
-
81
-
82
-
83
-
84
-
85
-
86
-
87
-
88
 |
 |

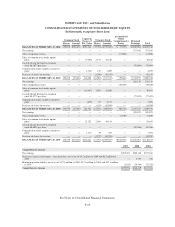
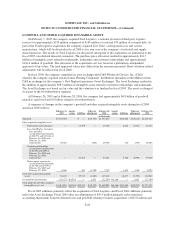
SUPERVALU INC. and Subsidiaries
CONSOLIDATED STATEMENTS OF CASH FLOWS
(In thousands)
February 26,
2005
(52 weeks)
February 28,
2004
(53 weeks)
February 22,
2003
(52 weeks)
Cash flows from operating activities
Net earnings $ 385,823 $ 280,138 $ 257,042
Adjustments to reconcile net earnings to net cash provided by operating
activities:
Depreciation and amortization 303,039 301,589 297,056
LIFO expense 6,112 4,734 4,741
Provision for losses on receivables 10,338 10,479 15,719
Loss (gain) on sale of property, plant and equipment 7,445 (1,802) (5,564)
Gain on sale of WinCo Foods, Inc. (109,238) — —
Restructure and other charges 26,416 15,523 2,918
Deferred income taxes 48,962 38,761 14,184
Equity in earnings of unconsolidated subsidiaries (14,325) (39,215) (39,724)
Other adjustments, net 3,154 4,339 3,675
Changes in assets and liabilities, net of effects from acquisition of business:
Receivables 18,049 23,407 (46,890)
Inventories 34,943 (19,331) (15,974)
Long-term notes receivable, net 24,880 14,620 (4,094)
Accounts payable 26,990 1,361 111,811
Income taxes currently payable (67,449) 82,781 22,707
Other assets and liabilities 86,427 129,442 (34,097)
Net cash provided by operating activities 791,566 846,826 583,510
Cash flows from investing activities
Proceeds from sale of assets 34,896 56,552 65,986
Proceeds from sale of WinCo Foods, Inc. 229,846 — —
Purchases of property, plant and equipment (262,790) (328,156) (396,609)
Purchase of Total Logistics, Inc. (163,766) — —
Net cash used in investing activities (161,814) (271,604) (330,623)
Cash flows from financing activities
Net (reduction) issuance of notes payable — (80,000) 56,000
Proceeds from issuance of long-term debt 3,813 — 296,535
Repayment of long-term debt (331,798) (131,063) (472,448)
Reduction of obligations under capital leases (33,004) (32,884) (29,767)
Dividends paid (80,220) (77,035) (75,648)
Net proceeds from the sale of common stock under option plans 39,375 23,127 31,617
Payment for purchase of treasury shares (55,959) (14,599) (42,159)
Net cash used in financing activities (457,793) (312,454) (235,870)
Net increase in cash and cash equivalents 171,959 262,768 17,017
Cash and cash equivalents at beginning of year 291,956 29,188 12,171
Cash and cash equivalents at end of year $ 463,915 $ 291,956 $ 29,188
SUPPLEMENTAL CASH FLOW INFORMATION
The company’s non-cash activities were as follows:
Leased asset additions and related obligations $ 62,898 $ 43,308 $ 42,829
Minimum pension liability, net of deferred taxes $ 5,849 $ 26,404 $ 72,328
Interest and income taxes paid:
Interest paid (net of amount capitalized) $122,131 $143,088 $171,089
Income taxes paid (net of refunds) $216,572 $ 29,081 $ 48,787
See Notes to Consolidated Financial Statements.
F-11