Albertsons 2005 Annual Report Download - page 19
Download and view the complete annual report
Please find page 19 of the 2005 Albertsons annual report below. You can navigate through the pages in the report by either clicking on the pages listed below, or by using the keyword search tool below to find specific information within the annual report.-
 1
1 -
2
-
3
-
4
-
5
-
6
-
7
-
8
-
 9
9 -
 10
10 -
 11
11 -
 12
12 -
 13
13 -
 14
14 -
 15
15 -
 16
16 -
 17
17 -
 18
18 -
 19
19 -
 20
20 -
 21
21 -
 22
22 -
 23
23 -
 24
24 -
 25
25 -
 26
26 -
 27
27 -
 28
28 -
 29
29 -
30
-
31
-
32
-
33
-
34
-
35
-
36
-
37
-
38
-
39
-
40
-
41
-
42
-
43
-
44
-
45
-
46
-
47
-
48
-
49
-
50
-
51
-
52
-
53
-
54
-
55
-
56
-
57
-
58
-
59
-
60
-
61
-
62
-
63
-
64
-
65
-
66
-
67
-
68
-
69
-
70
-
71
-
72
-
73
-
74
-
75
-
76
-
77
-
78
-
79
-
80
-
81
-
82
-
83
-
84
-
85
-
86
-
87
-
88
 |
 |
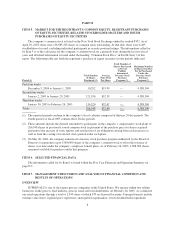
extreme value format, and the growing proportion of our retail food business, which operates at a higher gross
profit margin as a percentage of net sales than does the food distribution business.
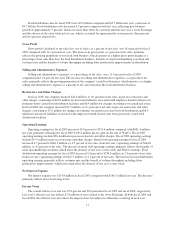
Selling and Administrative Expenses
Selling and administrative expenses, as a percentage of net sales, were 11.0 percent for fiscal 2004
compared with 10.5 percent in fiscal 2003. The increase in selling and administrative expenses, as a percent of
net sales, primarily reflects increases in employee benefit and incentive related costs, costs associated with the
Denver Disposition, including related reserves for closed stores and $10.8 million in additional reserves for non-
operating properties.
Restructure and Other Charges
In fiscal 2004, the company incurred $15.5 million, or 0.1 percent of net sales, in pre-tax restructure and
other charges, consisting of $7.0 million for changes in estimates on exited real estate in certain markets for food
distribution and $8.5 million for increased liabilities associated with employee benefit related costs from
previously exited food distribution facilities.
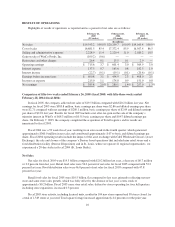
Operating Earnings
Operating earnings for fiscal 2004 increased 5.5 percent to $601.4 million compared with $569.9 million in
fiscal 2003. Fiscal 2004 operating earnings include $15.5 million in pre-tax restructure and other charges. Fiscal
2003 operating earnings include $2.9 million in pre-tax restructure and other charges. Retail food operating
earnings for fiscal 2004 increased 1.7 percent to $444.0 million, or 4.2 percent of net sales, from last year’s
operating earnings of $436.5 million, or 4.4 percent of net sales. The increase in retail food operating earnings
was primarily due to growth of new stores, improved merchandising execution and the benefit of the extra week
which were substantially offset by increases in employee benefit and incentive related costs, costs associated
with the Denver Disposition, including related reserves for closed stores, and the impact of the St. Louis Strike.
Food distribution operating earnings for fiscal 2004 increased 29.6 percent to $222.5 million, or 2.3 percent of
net sales, from fiscal 2003’s operating earnings of $171.6 million, or 1.8 percent of net sales. The increase in
food distribution operating earnings primarily reflects the increase in sales volume, benefits of efficiency
initiatives implemented during the course of the prior year and the benefit of the extra week.
Net Interest Expense
Net interest expense was $146.5 million in fiscal 2004 compared with $161.9 million in fiscal 2003. The
decrease primarily reflects lower borrowing levels that more than offset $5.8 million in pre-tax costs related to
the early redemption of $100.0 million of debt at a price of 103.956 percent in the third quarter of fiscal 2004.
Income Taxes
The effective tax rate was 38.4 percent and 37.0 percent in fiscal 2004 and fiscal 2003, respectively. The
increase in the effective tax rate in fiscal 2004 was due to $7.6 million of taxes due on the Asset Exchange.
Net Earnings
Net earnings were $280.1 million, or $2.09 per basic share and $2.01 per diluted share, in fiscal 2004
compared with net earnings of $257.0 million, or $1.92 per basic share and $1.86 per diluted share in fiscal 2003.
Weighted average basic shares increased to 134.0 million in fiscal 2004 compared with 133.7 million in
fiscal 2003. Weighted average diluted shares increased to 143.2 million in fiscal 2004 compared with 142.7
million shares in fiscal 2003, reflecting the net impact of stock option activity and shares repurchased under the
treasury stock program.
13