Albertsons 2005 Annual Report Download - page 82
Download and view the complete annual report
Please find page 82 of the 2005 Albertsons annual report below. You can navigate through the pages in the report by either clicking on the pages listed below, or by using the keyword search tool below to find specific information within the annual report.-
 1
1 -
2
-
3
-
4
-
5
-
6
-
7
-
8
-
9
-
10
-
11
-
12
-
13
-
14
-
15
-
16
-
17
-
18
-
19
-
20
-
21
-
22
-
23
-
24
-
25
-
26
-
27
-
28
-
29
-
30
-
31
-
32
-
33
-
34
-
35
-
36
-
37
-
38
-
39
-
40
-
41
-
42
-
43
-
44
-
45
-
46
-
47
-
48
-
49
-
50
-
51
-
52
-
53
-
54
-
55
-
56
-
57
-
58
-
59
-
60
-
61
-
62
-
63
-
64
-
65
-
66
-
67
-
68
-
69
-
70
-
71
-
 72
72 -
 73
73 -
 74
74 -
 75
75 -
 76
76 -
 77
77 -
 78
78 -
 79
79 -
 80
80 -
 81
81 -
 82
82 -
 83
83 -
 84
84 -
 85
85 -
 86
86 -
 87
87 -
 88
88
 |
 |

UNAUDITED QUARTERLY FINANCIAL INFORMATION
(In thousands, except per share data)
Unaudited quarterly financial information for SUPERVALU INC. and subsidiaries is as follows:
Fiscal Year Ended February 26, 2005
First
(16 wks)
Second
(12 wks)
Third
(12 wks)
Fourth
(12 wks)
Year
(52 wks)
Net sales $5,910,649 $4,486,963 $4,555,122 $4,590,506 $19,543,240
Gross profit $ 845,037 $ 655,138 $ 660,197 $ 701,396 $ 2,861,768
Net earnings $ 149,411 $ 78,536 $ 64,943 $ 92,933 $ 385,823
Net earnings per common share—basic $ 1.10 $ 0.58 $ 0.48 $ 0.69 $ 2.86
Net earnings per common share—diluted $ 1.04 $ 0.55 $ 0.46 $ 0.65 $ 2.71
Dividends declared per common share $ 0.1450 $ 0.1525 $ 0.1525 $ 0.1525 $ 0.6025
Weighted average shares—basic 135,244 135,230 134,343 135,116 135,003
Weighted average shares—diluted 145,378 144,888 144,058 145,243 144,924
Fiscal Year Ended February 28, 2004
First
(16 wks)
Second
(12 wks)
Third
(12 wks)
Fourth
(13 wks)
Year
(53 wks)
Net sales $5,836,287 $4,590,650 $4,738,983 $5,043,759 $20,209,679
Gross profit $ 800,746 $ 637,248 $ 645,630 $ 753,626 $ 2,837,250
Net earnings $ 73,670 $ 62,232 $ 48,616 $ 95,620 $ 280,138
Net earnings per common share—basic $ 0.55 $ 0.46 $ 0.36 $ 0.71 $ 2.09
Net earnings per common share—diluted $ 0.54 $ 0.45 $ 0.35 $ 0.67 $ 2.01
Dividends declared per common share $ 0.1425 $ 0.1450 $ 0.1450 $ 0.1450 $ 0.5775
Weighted average shares—basic 133,719 133,885 133,983 134,366 133,975
Weighted average shares—diluted 141,936 143,364 143,680 144,366 143,236
Note: Fiscal 2005 and fiscal 2004 net earnings include after-tax restructure and other items of $16.7 million
and $9.8 million, respectively.
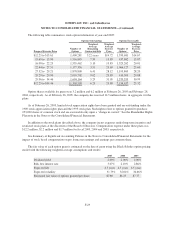
In accordance with EITF No. 04-08, as described in the Notes to the Consolidated Financial Statements, the
shares associated with the company’s contingently convertible debentures are included in the diluted earnings per
share computation and quarterly results for the first three quarters of the fiscal year ended February 26, 2005 and
for all of the fiscal year ended February 28, 2004 have been restated from previously reported amounts. The
quarterly earnings per share as reported and as restated for fiscal 2005 and 2004 follows:
Quarterly Earnings Per Share
Fiscal 2005 As Reported As Restated
First Quarter $1.09 $1.04
Second Quarter 0.57 0.55
Third Quarter 0.48 0.46
Fiscal 2004
First Quarter $0.55 $0.54
Second Quarter 0.46 0.45
Third Quarter 0.36 0.35
Fourth Quarter 0.70 0.67
F-36