Albertsons 2005 Annual Report Download - page 16
Download and view the complete annual report
Please find page 16 of the 2005 Albertsons annual report below. You can navigate through the pages in the report by either clicking on the pages listed below, or by using the keyword search tool below to find specific information within the annual report.-
 1
1 -
2
-
3
-
4
-
5
-
 6
6 -
 7
7 -
 8
8 -
 9
9 -
 10
10 -
 11
11 -
 12
12 -
 13
13 -
 14
14 -
 15
15 -
 16
16 -
 17
17 -
 18
18 -
 19
19 -
 20
20 -
 21
21 -
 22
22 -
 23
23 -
 24
24 -
 25
25 -
 26
26 -
27
-
28
-
29
-
30
-
31
-
32
-
33
-
34
-
35
-
36
-
37
-
38
-
39
-
40
-
41
-
42
-
43
-
44
-
45
-
46
-
47
-
48
-
49
-
50
-
51
-
52
-
53
-
54
-
55
-
56
-
57
-
58
-
59
-
60
-
61
-
62
-
63
-
64
-
65
-
66
-
67
-
68
-
69
-
70
-
71
-
72
-
73
-
74
-
75
-
76
-
77
-
78
-
79
-
80
-
81
-
82
-
83
-
84
-
85
-
86
-
87
-
88
 |
 |
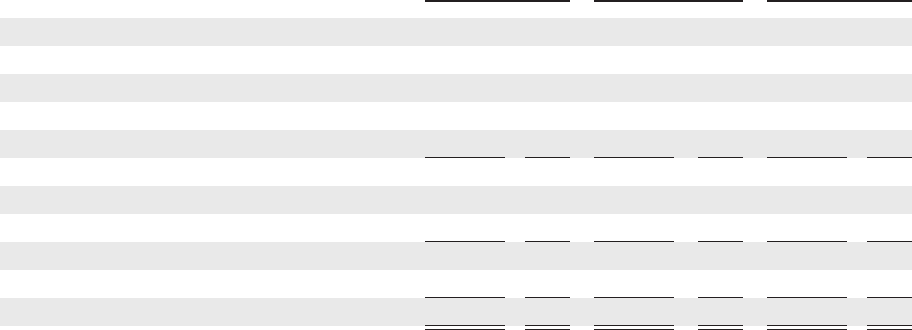
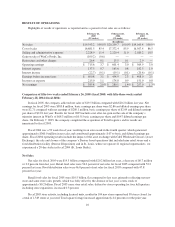
RESULTS OF OPERATIONS
Highlights of results of operations as reported and as a percent of net sales are as follows:
February 26,
2005
(52 weeks)
February 28,
2004
(53 weeks)
February 22,
2003
(52 weeks)
(In millions)
Net sales $19,543.2 100.0% $20,209.7 100.0% $19,160.4 100.0%
Cost of sales 16,681.5 85.4 17,372.4 85.9 16,567.4 86.5
Selling and administrative expenses 2,228.9 11.4 2,220.4 11.0 2,020.2 10.5
Gain on sale of WinCo Foods, Inc. (109.2) (0.6) — — — —
Restructure and other charges 26.4 0.1 15.5 0.1 2.9 —
Operating earnings $ 715.6 3.7 $ 601.4 3.0 $ 569.9 3.0
Interest expense 137.5 0.7 165.6 0.8 182.5 1.0
Interest income (22.7) (0.1) (19.1) (0.1) (20.6) (0.1)
Earnings before income taxes $ 600.8 3.1 $ 454.9 2.3 $ 408.0 2.1
Income tax expense 215.0 1.1 174.8 0.9 151.0 0.8
Net earnings $ 385.8 2.0% $ 280.1 1.4% $ 257.0 1.3%
Comparison of fifty-two weeks ended February 26, 2005 (fiscal 2005) with fifty-three weeks ended
February 28, 2004 (fiscal 2004):
In fiscal 2005, the company achieved net sales of $19.5 billion compared with $20.2 billion last year. Net
earnings for fiscal 2005 were $385.8 million, basic earnings per share were $2.86 and diluted earnings per share
were $2.71 compared with net earnings of $280.1 million, basic earnings per share of $2.09 and diluted earnings
per share of $2.01 last year. Results for fiscal 2005 include a net after-tax gain on the sale of the company’s
minority interest in WinCo of $68.3 million or $0.51 basic earnings per share and $0.47 diluted earnings per
share. On February 7, 2005, the company completed the acquisition of Total Logistics and its results are
immaterial to fiscal 2005.
Fiscal 2004 was a 53 week fiscal year, resulting in an extra week in the fourth quarter, which generated
approximately $360.0 million in net sales and contributed approximately $.07 to basic and diluted earnings per
share. Fiscal 2004 operating results include the impact of the asset exchange with C&S Wholesale Grocers (Asset
Exchange), the sale and closure of the company’s Denver based operations that included nine retail stores and a
food distribution facility (Denver Disposition) and in St. Louis, where we operate 21 regional supermarkets, we
experienced a 28-day strike in fiscal 2004 (St. Louis Strike).
Net Sales
Net sales for fiscal 2005 were $19.5 billion compared with $20.2 billion last year, a decrease of $0.7 million
or 3.3 percent from last year. Retail food sales were 54.0 percent of net sales for fiscal 2005 compared with 52.2
percent last year. Food distribution sales were 46.0 percent of net sales for fiscal 2005 compared with 47.8
percent last year.
Retail food sales for fiscal 2005 were $10.5 billion, flat compared to last year, primarily reflecting net new
store and same store sales growth, which was fully offset by the absence of last year’s extra week of
approximately $0.2 billion. Fiscal 2005 same store retail sales, defined as stores operating for four full quarters,
including store expansions, increased 0.3 percent.
Fiscal 2005 store activity, including licensed units, resulted in 104 new stores opened and 38 stores closed, for
a total of 1,549 stores at year end. Total square footage increased approximately 4.2 percent over the prior year.
10