Albertsons 2005 Annual Report Download - page 48
Download and view the complete annual report
Please find page 48 of the 2005 Albertsons annual report below. You can navigate through the pages in the report by either clicking on the pages listed below, or by using the keyword search tool below to find specific information within the annual report.-
 1
1 -
2
-
3
-
4
-
5
-
6
-
7
-
8
-
9
-
10
-
11
-
12
-
13
-
14
-
15
-
16
-
17
-
18
-
19
-
20
-
21
-
22
-
23
-
24
-
25
-
26
-
27
-
28
-
29
-
30
-
31
-
32
-
33
-
34
-
35
-
36
-
37
-
 38
38 -
 39
39 -
 40
40 -
 41
41 -
 42
42 -
 43
43 -
 44
44 -
 45
45 -
 46
46 -
 47
47 -
 48
48 -
 49
49 -
 50
50 -
 51
51 -
 52
52 -
 53
53 -
 54
54 -
 55
55 -
 56
56 -
 57
57 -
 58
58 -
59
-
60
-
61
-
62
-
63
-
64
-
65
-
66
-
67
-
68
-
69
-
70
-
71
-
72
-
73
-
74
-
75
-
76
-
77
-
78
-
79
-
80
-
81
-
82
-
83
-
84
-
85
-
86
-
87
-
88
 |
 |

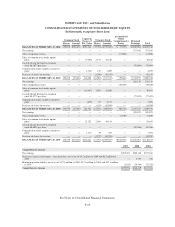
SUPERVALU INC. and Subsidiaries
FIVE YEAR FINANCIAL AND OPERATING SUMMARY
2005 2004 2003 2002 2001
Statement of Earnings Data (a)
Net sales $19,543,240 $20,209,679 $19,160,368 $20,293,040 $22,520,384
Cost of sales 16,681,472 17,372,429 16,567,397 17,704,197 19,976,436
Selling and administrative expenses 2,228,944 2,220,329 2,020,110 2,037,771 2,042,259
Gain on sale of Winco Foods, Inc. (109,238) ————
Restructure and other charges 26,416 15,523 2,918 46,300 171,264
Operating earnings 715,646 601,398 569,943 504,772 330,425
Interest, net 114,782 146,518 161,939 172,774 190,835
Earnings before income taxes 600,864 454,880 408,004 331,998 139,590
Provision for income taxes 215,041 174,742 150,962 133,672 66,720
Net earnings 385,823 280,138 257,042 198,326 72,870
Net earnings per common share—basic 2.86 2.09 1.92 1.49 0.55
Net earnings per common share—
diluted (b) 2.71 2.01 1.86 1.47 0.55
Balance Sheet Data (a)
Inventories (FIFO) (c) $ 1,180,602 $ 1,214,122 $ 1,194,791 $ 1,178,817 $ 1,477,180
Working capital (c) 643,477 361,394 288,572 36,031 (125,408)
Net property, plant and equipment 2,201,005 2,134,436 2,220,850 2,208,633 2,232,794
Total assets 6,278,342 6,161,771 5,896,245 5,796,249 6,343,152
Long-term debt (d) 1,578,867 1,633,721 2,019,658 1,875,873 2,008,474
Stockholders’ equity 2,510,561 2,209,574 2,009,240 1,899,138 1,783,149
Other Statistics (a)
Net earnings as a percent of net sales 1.97% 1.39% 1.34% 0.98% 0.32%
Return on average stockholders’ equity 16.24% 13.29% 12.97% 10.70% 3.96%
Book value per common share $ 18.53 $ 16.40 $ 15.03 $ 14.29 $ 13.47
Current ratio (c) 1.39:1 1.20:1 1.19:1 1.02:1 0.95:1
Debt to capital ratio (e) 40.1% 46.7% 51.8% 54.3% 59.7%
Dividends declared per common share $ 0.60
1
⁄
4
$ 0.57
3
⁄
4
$ 0.56
3
⁄
4
$ 0.55
3
⁄
4
$ 0.54
3
⁄
4
Weighted average common shares
outstanding—basic 135,003 133,975 133,730 132,940 132,251
Weighted average common shares
outstanding—diluted (b) 144,924 143,236 142,695 136,405 132,829
Depreciation and amortization (f) $ 303,039 $ 301,589 $ 297,056 $ 340,750 $ 343,779
Capital expenditures (g) $ 325,688 $ 371,464 $ 439,438 $ 388,658 $ 511,673
Net cash provided by operating activities $ 791,566 $ 846,826 $ 583,510 $ 702,964 $ 608,501
Net cash used in investing activities $ (161,814) $ (271,604) $ (330,623) $ (235,129) $ (353,876)
Net cash used in financing activities $ (457,793) $ (312,454) $ (235,870) $ (466,060) $ (255,149)
Notes:
(a) Fiscal 2004 statement of earnings data includes 53 weeks, and all other years include 52 weeks. Dollars in
thousands except per share and percentage data.
(b) The provisions of Emerging Issues Task Force (EITF) Issue No. 04-8, “The Effect of Contingently
Convertible Instruments on Diluted Earnings per Share,” were adopted in the fourth quarter of fiscal 2005
and prior years’ diluted earnings per share amounts were restated. The implementation of EITF 04-8 did not
F-2